
Figure 1.
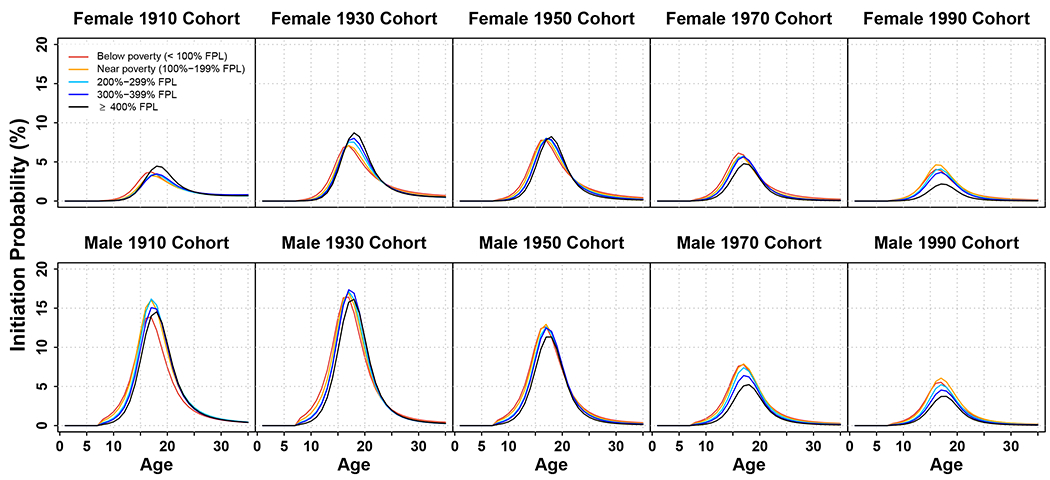
Age-specific smoking initiation probabilities (percentage) for selected birth cohorts by family income-to-poverty ratio and gender (females – top panels, males – bottom panels). Lines represent the initiation probabilities for Below poverty (<100% FPL, red), Near poverty (100%-199% FPL, orange), 200%-299% FPL (sky blue), 300%-399% FPL (blue), and ≥400% FPL (black). FPL=Federal Poverty Level. An interactive version of this figure’s data can be found at: https://apps.cisnetsmokingparameters.org/income/