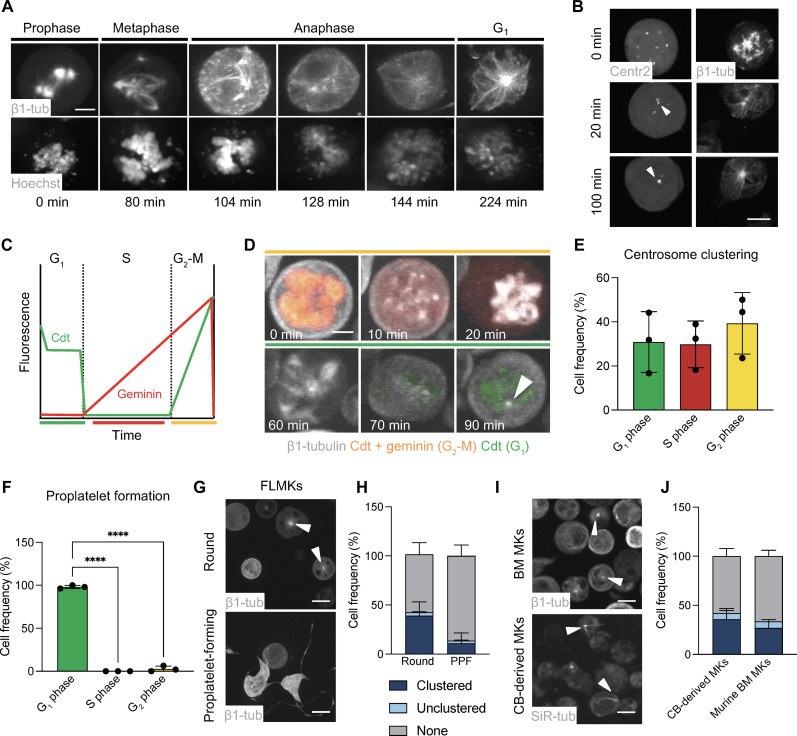
Fig. 1. Cell cycle dynamics regulate centrosome clustering and proplatelet formation in murine MKs.
(A) Visualization of β1-tubulin and DNA (Hoechst) during the different stages of mitosis in FLMKs transduced with MSCV–β1-tubulin–dendra2 before proplatelet formation. Live-cell image acquisition was performed every 10 min. One representative cell is shown. Scale bar, 10 μm. (B) Visualization of centrosome clustering in MSCV-centrin2-GFP– and MSCV–β1-tubulin–dendra2–transduced FLMKs following mitosis. Images were acquired as described above. Scale bar, 10 μm. White arrowheads point at supercentrosomes. (C) Differential gene expression of MSCV-FUCCI cell cycle reporter: mCherry (geminin, red) and/or mVenus (cdt, green) are expressed depending on the cell cycle stage. (D) Visualization of FUCCI expression cycles in FLMKs stained with SiR-tubulin. Image acquisition was performed every 10 min. Scale bar, 8 μm. Arrowhead highlights clustered centrosome. (E and F) Percentage of cells in different cell cycle stages during supercentrosome formation (E) and proplatelet formation (F). n = 3. At least 200 cells were analyzed per mouse. Data are presented as means ± SD. One-way analysis of variance (ANOVA) with Sidak correction for multiple comparisons. ****P < 0.0001. Colors coordinate with FUCCI expression. (G and H) Visualization and quantification of centrosome clustering in murine FLMKs transduced with MSCV–β1-tubulin–dendra2 before and during proplatelet formation (PPF). n = 3. At least 200 cells were analyzed per mouse. Data are presented as means ± SD. Arrowheads highlight clustered centrosome. (I and J) Visualization and quantification of centrosome clustering in murine BM MKs (top) and human umbilical cord blood (CB)–derived MKs. n = 3. At least 200 cells were analyzed per sample. Data are presented as means ± SD.

