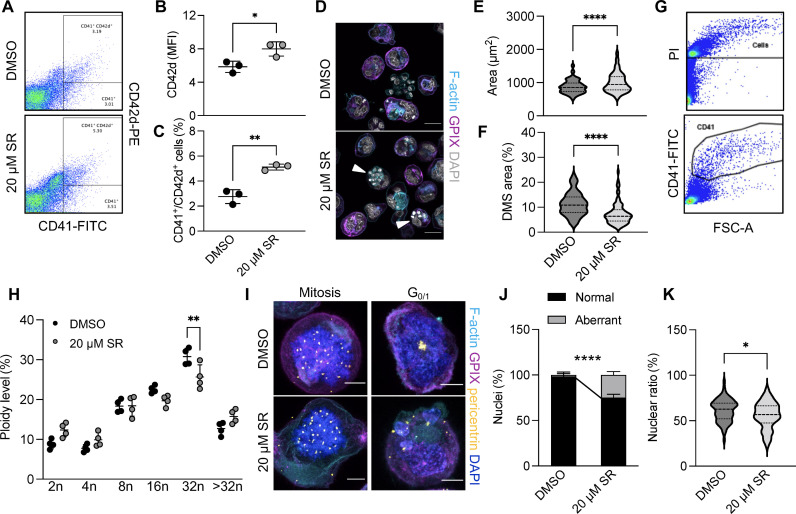
Fig. 5. KIFC1 is essential for centrosome clustering in murine MKs.
(A to C) Representative flow plots (A) and quantification of CD42d MFI (B) and CD41/CD42d-positive cells (C) of DMSO- and SR-treated, in vitro differentiated BM MKs. n = 3. Data are presented as means ± SD. Unpaired, two-tailed Student’s t test. *P < 0.05; **P < 0.01. (D) Visualization of the DMS (GPIX and Phalloidin) in BM MKs treated with DMSO or 20 μM SR after 4 days in culture. Scale bars, 25 μm. (E and F) Quantification of cell size (E) and DMS area in relation to cell size (F) in MKs treated with DMSO or 20 μM SR. n = 3. Data are presented as means ± SD. Unpaired, two-tailed Student’s t test. ****P < 0.0001. (G and H) Ploidy distribution of DMSO- and SR-treated, in vitro differentiated BM MKs was assessed using flow cytometry. n = 4. Data are presented as means ± SD. Two-way ANOVA with Sidak correction for multiple comparisons. **P < 0.01. (I) Visualization of DNA and centrosomes in BM MKs treated with DMSO or 20 μM SR undergoing different cell cycle stages. Scale bars, 10 μm. (J and K) Quantification of micronucleus formation (J) and nuclear ratio in relation to cell size (K) in BM MKs treated with DMSO or 20 μM SR. Data are presented as means ± SD. Unpaired, two-tailed Student’s t test. *P < 0.05; ****P < 0.0001.

