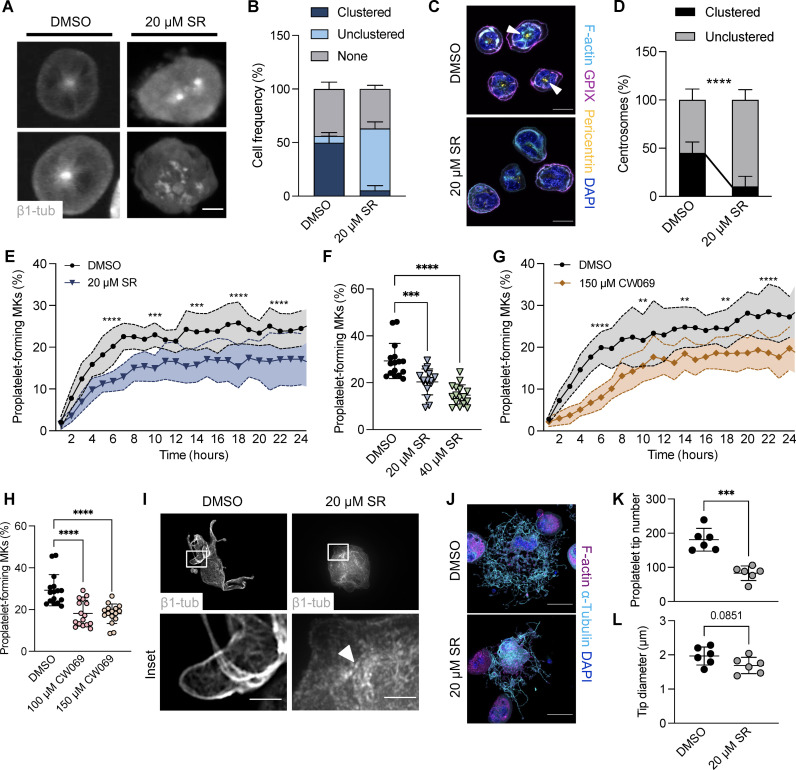
Fig. 6. Impaired proplatelet formation following KIFC1 inhibition in murine MKs in vitro.
(A and B) Visualization (A) and quantification (B) of clustered centrosomes in FLMKs by live-cell imaging treated with DMSO or 20 μM KIFC1 inhibitor SR. Image acquisition was performed every hour. Scale bar, 10 μm. At least 100 cells were analyzed per mouse. Data are presented as means ± SD. (C and D) Visualization (C) and quantification (D) of clustered centrosomes in BM MKs treated with DMSO or the KIFC1 inhibitor SR (20 μM). n = 2. Scale bars, 25 μm. At least 100 cells were analyzed per mouse. Data are presented as means ± SD. Unpaired, two-tailed Student’s t test. ****P < 0.0001. (E) Proplatelet formation of FLMKs treated with DMSO or 20 μM SR was assessed using the IncuCyte imaging system and a customized analysis pipeline. n = 4; four technical replicates. Data are presented as means ± SD. Two-way ANOVA with Sidak correction for multiple comparisons. ***P < 0.001; ****P < 0.0001. (F) Percentage of proplatelet-forming MKs at 24 hours upon treatment with DMSO or 20 or 40 μM SR. n = 4; four technical replicates. Data are presented as means ± SD. One-way ANOVA with Sidak correction for multiple comparisons. ***P < 0.001; ****P < 0.0001. (G) Proplatelet formation from FLMKs upon treatment with DMSO or 150 μM CW069 was analyzed using the IncuCyte imaging system and a custom analysis pipeline. n = 4; four technical replicates. Data are presented as means ± SD. Two-way ANOVA with Sidak correction for multiple comparisons. **P < 0.01; ****P < 0.0001. (H) Percentage of proplatelet-forming MKs at 24 hours upon treatment with DMSO or 100 or 150 μM CW069. Data are presented as means ± SD. One-way ANOVA with Sidak correction for multiple comparisons. ****P < 0.0001. (I) DMSO- and SR-treated, MSCV–β1-tubulin–dendra2–transduced FLMKs were spun down onto coverslips. Scale bars, 20 μm and 5 μm (inset). (J) BM MKs were treated with DMSO or 20 μM SR and were allowed to form proplatelets on a CD31-coated surface for 24 hours. MKs were stained for α-tubulin and F-actin. Scale bars, 50 μm. (K and L) Proplatelet tip number and tip diameter were analyzed using ImageJ software. n = 6. Data are presented as means ± SD. Unpaired, two-tailed Student’s t test. ***P < 0.001.

