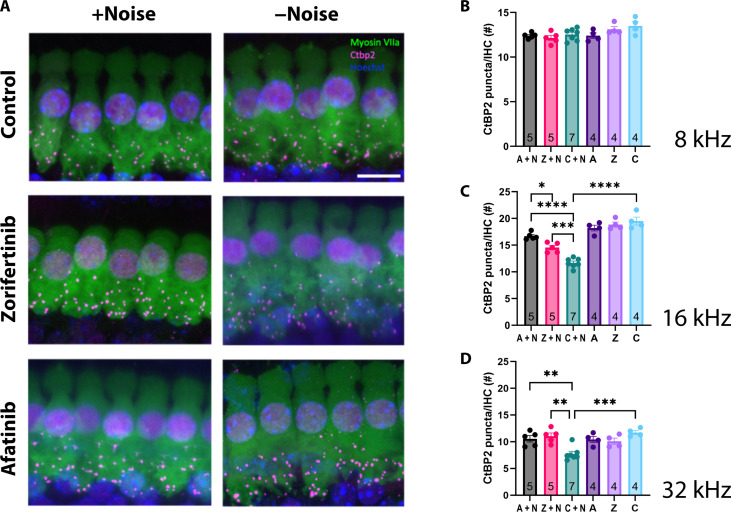
Fig. 5. Afatinib and zorifertinib protect against noise-induced cochlear synaptopathy in mice.
(A) Representative maximum intensity projections of the 16- to 22-kHz region of the cochlea following drug treatment and with (left) or without noise (right). Hair cells were labeled using Myosin VIIa, presynaptic puncta were labeled using CtBP2, and nuclei were counterstained with Hoechst. (B to D) Zorifertinib and afatinib protect against noise-induced cochlear synaptopathy, resulting in significantly less CtBP2 puncta loss with drug + noise than control + noise. Individual data points are the average of the left and right cochlea from each mouse. A, afatinib only; Z, zorifertinib only; C, control (age-matched); A + N, noise-exposed group treated with afatinib; Z + N, noise-exposed group treated with zorifertinib; C + N, noise-exposed group treated with vehicle for the drugs. Data are presented as means ± SEM. The sample size is indicated inside the vertical bars for each group. One-way ANOVA with Bonferroni’s post hoc test. 16 kHz: A + N versus C + N ****P < 0.0001, Z + N versus C + N ***P = 0.0008, C + N versus C ****P < 0.0001, A + N vs Z + N *P = 0.0353; 32 kHz: A + N versus C + N **P = 0.0071, Z + N versus C + N **P = 0.0012, C + N versus C ***P = 0.0003. Scale bar, 10 μm.

