
Fig. 3. In vivo biocompatibility and degradation of the MeTro sealant using a rat subcutaneous model.
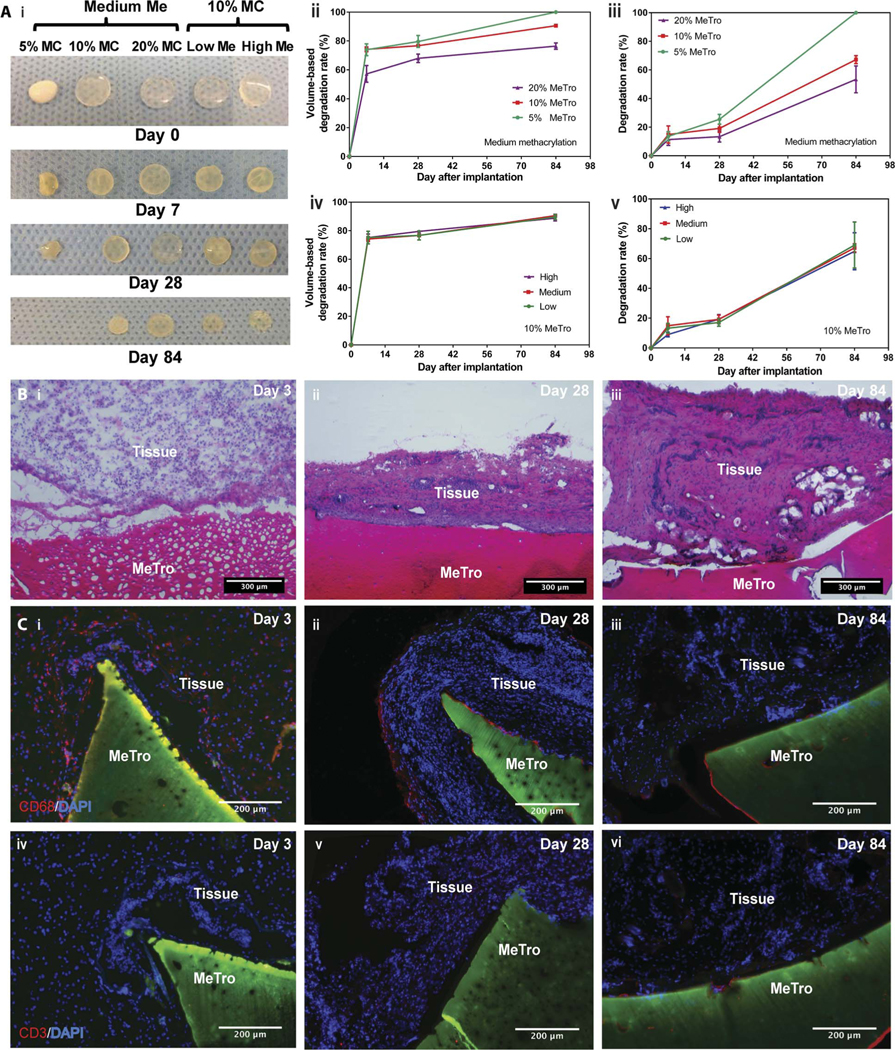
(A) Evaluation of the in vivo degradation of MeTro sealants on days 0, 7, 28, and 84 of implantation (n = 4). (i) Representative images of the MeTro hydrogel implants with different extents of methacryloyl substitution (Me) and MeTro concentrations (MC). In vivo MeTro degradation based on volume loss of the implant for (ii) varying MeTro concentrations with medium methacryloyl substitution and (iv) varying extents of methacryloyl substitution at 10% (w/v) MeTro concentration. In vivo MeTro degradation based on weight loss of the implant for (iii) variable MeTro concentration with medium methacryloyl substitution and (v) variable degree of methacryloyl substitution at 10% (w/v) MeTro concentration. The in vivo degradation profile of MeTro hydrogels shows significant volume loss by day 7 and almost constant weight loss afterward until day 84. (B) Histology images of MeTro with the surrounding tissue stained with H&E after (i) 3 days, (ii) 28 days, and (iii) 84 days of implantation in subcutaneous tissue of a rat using 20% MeTroconcentration and medium methacryloyl substitution (scale bars, 300 μm). H&E reveals insignificant amount of inflammatory cells. (C) Immunostaining of subcutaneously implanted MeTro hydrogels showing macrophage (CD68) only at (i) day 3 but disappeared at days (ii) 28 and (iii) 84, and resulting in no local lymphocyte infiltration (CD3) at days (iv) 3, (v) 28, and (vi) 84 (scale bars, 200 μm). Green color in (C) and (D) represents the autofluorescent MeTro gel, red color represents the lymphocytes, and blue color represents the nuclei (DAPI).