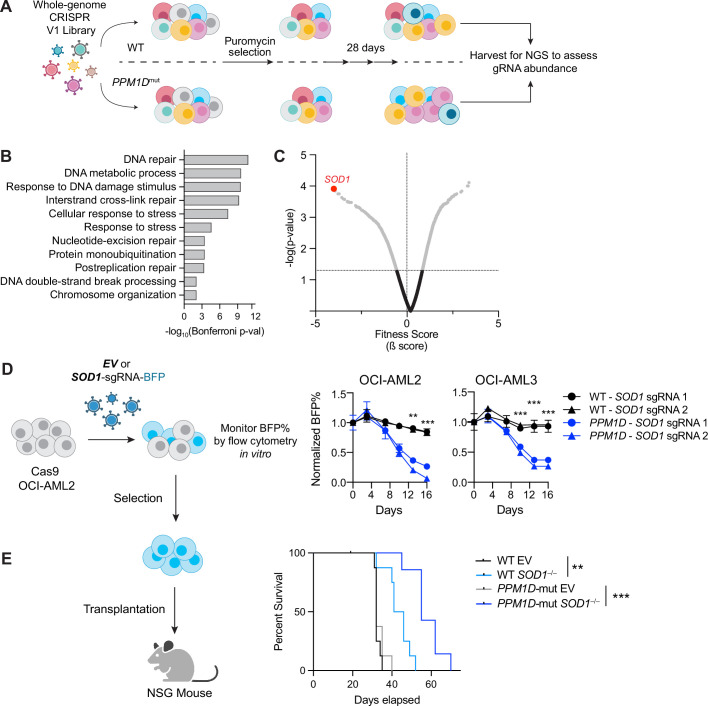
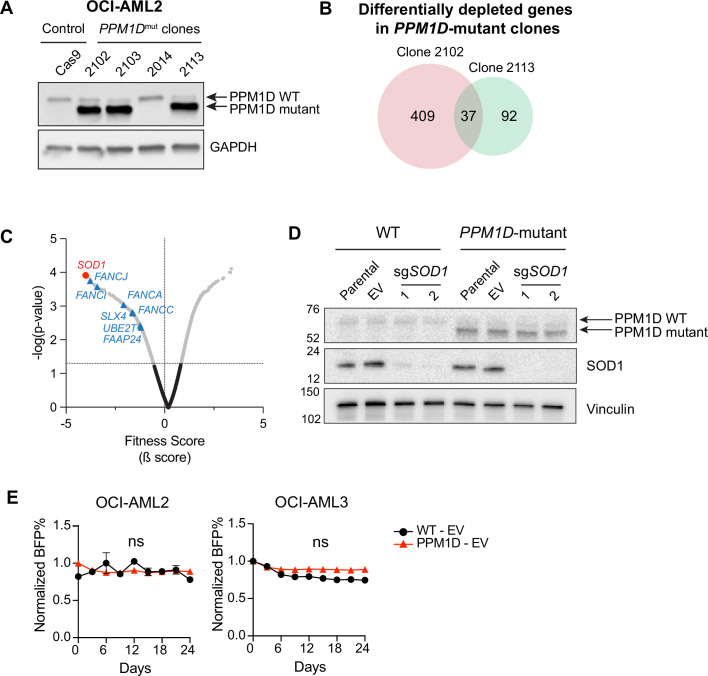
Figure 1. SOD1 is a synthetic-lethal vulnerability of PPM1D-mutant leukemia cells.
(A) Schematic of whole-genome CRISPR dropout screen. Wild-type (WT) Cas9-expressing OCI-AML2 and two isogenic PPM1D-mutant lines were transduced with the Human Improved Whole Genome Knockout CRISPR library V1 containing 90,709 guide RNAs (gRNAs) targeting 18,010 human genes at low multiplicity of infection (MOI~0.3). Each condition was performed in technical triplicates. Three days post-transduction, cells underwent puromycin selection for 3 days. Cells were harvested at day 10 as the initial timepoint and then harvested every 3 days afterward. sgRNA-sequencing was performed on cells collected on day 28. (B) Top biological processes based on gene ontology analysis of the top 37 genes essential for PPM1D-mutant cell survival. Enrichment and depletion of guides and genes were analyzed using MAGeCK-VISPR by comparing read counts from each PPM1D-mutant cell line replicate with counts from the initial starting population at day 10. (C) Volcano plot of synthetic-lethal hits ranked by fitness score with a negative score indicating genes for which their knockout leads to decreased growth or survival. SOD1 (highlighted) was the top hit from the screen. (D) Left: Schematic of competitive proliferation assays used for validation of CRISPR targets. Right: WT and PPM1D-mutant Cas9-OCI-AML2 and Cas9-OCI-AML3 cells were transduced with lentiviruses containing a single SOD1-gRNA with a blue fluorescent protein (BFP) reporter. Cells were assayed by flow cytometry every 3–4 days and normalized to the BFP percentage at day 3 post-transduction. Two unique gRNAs against SOD1 were used per cell line and each condition was performed in technical duplicates; multiple unpaired t-tests, **p<0.01, ***p<0.001. (E) Left: Cas9-expressing WT and PPM1D-mutant cells were transduced with control or sgSOD1-containing lentiviruses and underwent puromycin (3 µg/mL) selection for 3 days prior to transplantation. Sublethally irradiated (250 cGy) NSG mice were intravenously transplanted with 3×10⁶ cells. Right: Kaplan-Meier survival curve of mice transplanted with WT or PPM1D-mutant (gray) leukemia cells with or without SOD1 deletion. The median survival of mice transplanted with WT, WT/SOD1–/–, PPM1Dmut, and PPM1Dmut/SOD1–/– leukemia cells was 32, 43, 32, and 55 days, respectively; Mantel-Cox test, **p<0.01, ***p<0.001.


