. 2024 Jun 18;12:RP91611. doi: 10.7554/eLife.91611

Figure 2. PPM1D-mutant cells are sensitive to SOD1 inhibition and have increased oxidative stress.

(A,B) Dose response curves for cell viability with SOD1-inhibitor (LCS-1) (A) or LCS-1 in combination with 0.25 uM NAC (B) in WT and PPM1D-mutant leukemia cell lines after 24-hours. Mean + SD (n=3) is shown with a non-linear regression curve. All values are normalized to the baseline cell viability with vehicle, as measured by MTT assay. (C) Endogenous cytoplasmic superoxide levels of WT and PPM1D-mutant leukemia cell lines were measured using dihydroethidium (5 uM). The mean fluorescence intensity (MFI) of dihydroethidium was measured by flow cytometry. Mean + SD (n=3) is shown. (D) Lipid peroxidation measured using BODIPY 581/591 staining (2.5 uM) of WT and PPM1D-mutant OCI-AML2 cells. The MFI was measured by flow cytometry. Mean + SD (n=3) is shown. (E-F) Measure of total reactive oxygen species using 2’,7’–dichlorofluorescin diacetate (DCFDA) staining (10 uM) measured by flow cytometry. WT and PPM1D-mutant OCI-AML2 cells were measured at baseline and 24-hrs after SOD1 inhibition (ATN-224 12.5 uM, LCS-1 0.625 uM) (E) or 24-hrs after pharmacologic PPM1D inhibition (GSK2830371, 5 uM) (F); unpaired t-tests were used for statistical analyses, ns=non-significant (p>0.05), **p<0.01, ***p<0.001, ****p<0.0001.

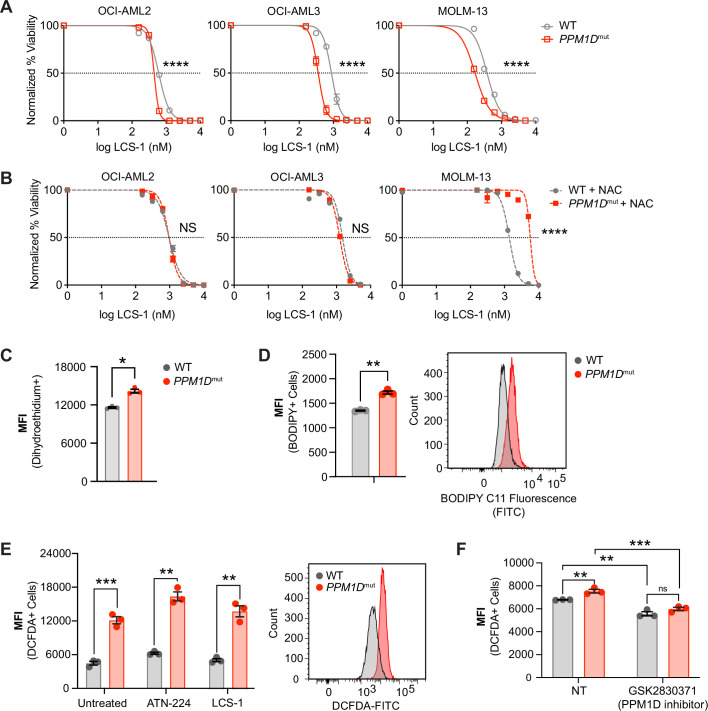
Figure 2.

Figure 2—figure supplement 1. PPM1D-mutant cells have increased oxidative stress.

Figure 2—figure supplement 1.

(A) Superoxide dismutase (SOD) activity assays in OCI-AML2 and OCI-AML3 cells at baseline (NT), or treated with high (12.5 µM) or low (6.25 µM) doses of ATN-224 for 16 hr. (B) Left: Representative flow cytometry plots of wild-type (WT) and PPM1D-mutant cells treated with ATN-224 (25 µM for 24 hr) and stained for Annexin V-APC and PI for apoptosis; multiple unpaired t-tests, ns = non-significant, *p<0.05, **p<0.01, ***p<0.001, ****p<0.0001. (C) Endogenous mitochondrial superoxide levels of WT and PPM1D-mutant leukemia cell lines were measured using MitoSOX Green staining (1 µM). The mean fluorescence intensity (MFI) of MitoSOX Green was measured by flow cytometry. Mean ± SD (n=3) is shown.
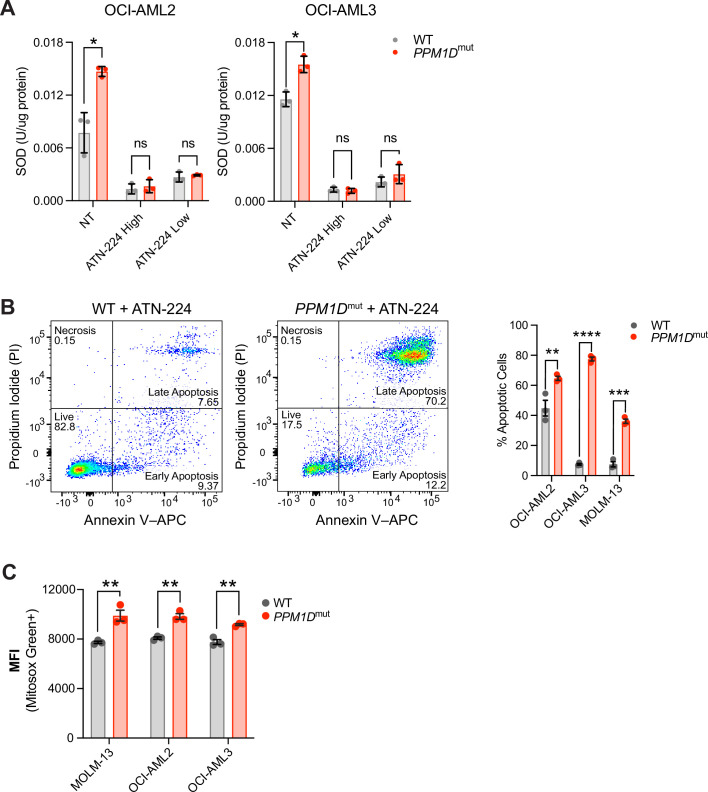
Figure 2—figure supplement 2. PPM1D-mutant cells have increased oxidative stress.

Figure 2—figure supplement 2.

(A,B) Dose-response curves for cell viability with SOD1 inhibitor (ATN-224) (A) or ATN-224 in combination with 0.25µM N-acetylcysteine (NAC) (B) in wild-type (WT) and PPM1D-mutant leukemia cell lines after 24hr. Mean ± SD (n=3) is shown along with a non-linear regression curve. All values are normalized to the baseline cell viability with vehicle, as measured by MTT assay. (C) Immunoblot of SOD2 expression in WT and PPM1D-mutant cells at baseline and after SOD1 deletion. WT and PPM1D-mutant Cas9-OCI-AML2 cells were transduced with control (empty vector [EV]) or sgSOD1 lentiviruses. Two sgRNAs targeting SOD1 were tested. Three days post-transduction, the cells underwent puromycin selection (3 µg/mL) for days after which they were harvested for western blot. Blots were probed with anti-PPM1D (1:1000), anti-SOD2 (1:1000), and anti-vinculin (1:2500). (D) Total reactive oxygen species (ROS) of WT and Ppm1d-mutant mouse embryonic fibroblasts (MEFs) measured by 2’7’-dichlorofluorescein diacetate (DCFDA) (10 µM) staining. Mean fluorescence intensity (MFI) was determined by flow cytometry. n=6 biological replicates were used for each genotype. Data shown are the mean of each biological replicate; unpaired t-test. (E) Total ROS of WT GM12878 (gray) and PPM1D-mutant (pink) patient lymphoblastoid cell lines (LCLs) at baseline and after 24 hr of SOD1 inhibition measured by DCFDA (10 µM) staining. MFI was determined by flow cytometry; multiple unpaired t-tests. (F) Dose-response curve of WT and PPM1D-mutant LCLs after ATN-224 treatment. IC50s of WT and PPM1D-mutant LCLs were 48.8 µM and 20.51 µM, respectively, as measured by MTT assay; non-linear regression analysis, ns = non-significant (p>0.05), **p<0.01, ***p<0.001, ****p<0.0001.
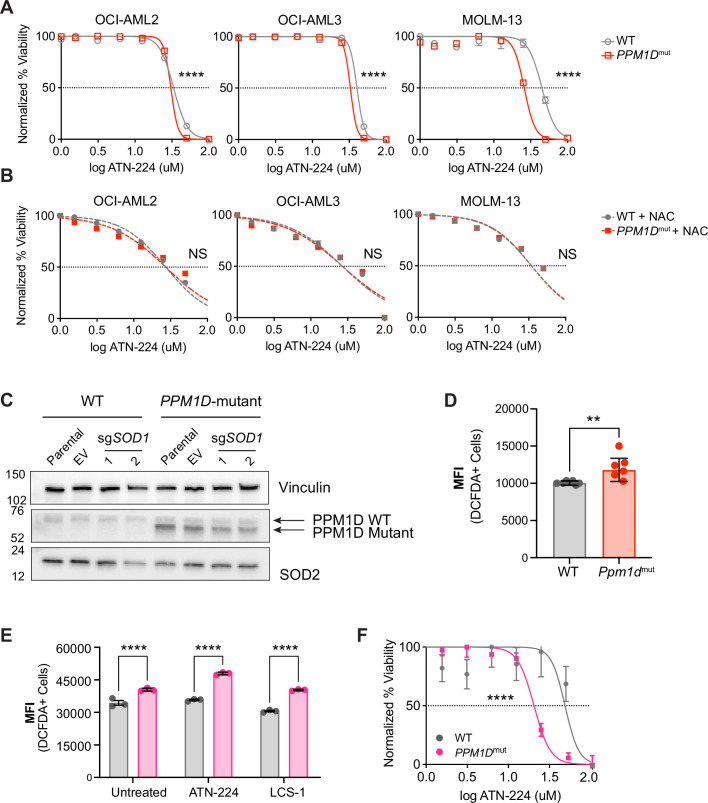
Figure 2—figure supplement 2—source data 1. Western blot of SOD2 expression at baseline and after SOD1 deletion.