. 2024 Jun 18;12:RP91611. doi: 10.7554/eLife.91611

Figure 5. PPM1D mutations increase genomic instability and impair non-homologous end-joining.

(A) Left: Representative images of comet assays of mouse embryonic fibroblasts (MEFs). Two biological replicates were assessed for each genotype. Right: Quantification of n≥150 comets per experimental group with the Comet IV software; two-way ANOVA. (B) Mean fluorescent intensity (MFI) of 8-oxo-2′-deoxyguanosine (8-oxo-dG) lesions within wild-type (WT) and PPM1D-mutant OCI-AML2 cells as measured by flow cytometry; Student’s t-test. (C) Left: Representative images of metaphase spreads of WT and Ppm1d-mutant mouse primary B-cells treated with low (0.5 µM) or high (5 µM) doses of cisplatin. Right: n≥50 metaphase cells were quantified in each experimental condition for chromosomal aberrations (white arrows). n=2 biological replicates used for each genotype. Student’s t-test was used for statistical analysis. (D–E) Left: Schematic of the homologous recombination (D) or non-homologous end-joining (E) U2OS DNA damage repair cassettes. Right: Quantification of GFP% analyzed by flow cytometry 48 hr after induction of DNA damage by I-SceI transduction; Student’s t-test. (F) Comet assay quantification of WT and PPM1D-mutant Cas9-OCI-AML2 cells 6 days after lentiviral transduction with the empty vector (EV) control, or sgSOD1 to induce SOD1 deletion. Quantification and analyses of tail moments were performed using the Comet IV software. n≥150 comets were scored per experimental group; two-way ANOVA. Data are mean ± SD (n=3), ns = non-significant (p>0.05), *p<0.05, **p<0.01, ***p<0.001, ****p<0.0001.

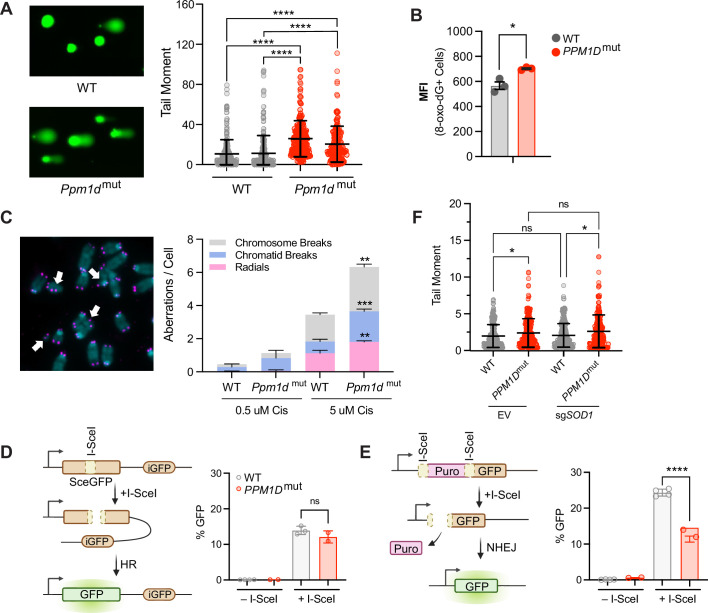
Figure 5—source data 1. Comet assay assessing baseline levels of DNA damage in WT and Ppm1d-mutant mouse embryonic fibroblasts.
Figure 5—source data 2. Metaphase spread of WT and Ppm1d-mutant mouse primary B-cells after treatment with cisplatin.

Figure 5.

Figure 5—figure supplement 1. PPM1D-mutations increase genomic instability and impairs non-homologous end-joining repair.

Figure 5—figure supplement 1.

(A) Left: Sanger sequencing traces of the parental U2OS cell line harboring a c.1372 C>T mutation in PPM1D and the CRISPR-edited U2OS cell line with mutation corrected to wild-type (WT) PPM1D. Right: Immunoblot validation of these clones are shown. Lysates were probed with anti-PPM1D (1:1000) and anti-GAPDH (1:1000). (B,C) Left: Representative images of Rad51 and 53BP1 immunofluorescence microscopy. Mouse embryonic fibroblasts were treated with 10 Gy irradiation, harvested 1 hr post-irradiation and stained for the indicated markers. Right: Quantification of the number of foci per cell is shown. Analysis was performed using CellProfiler. n>100 cells for each condition; Student’s t-test. (D) Comet assay quantification of mouse embryonic fibroblasts at baseline and after 1 hr post-irradiation (10 Gy). Quantification and analyses of tail moments were performed using the Comet IV software. n≥150 comets were scored per experimental group; two-way ANOVA, ns = non-significant (p>0.05), *p<0.05, **p<0.01, ***p<0.001, ****p<0.0001.
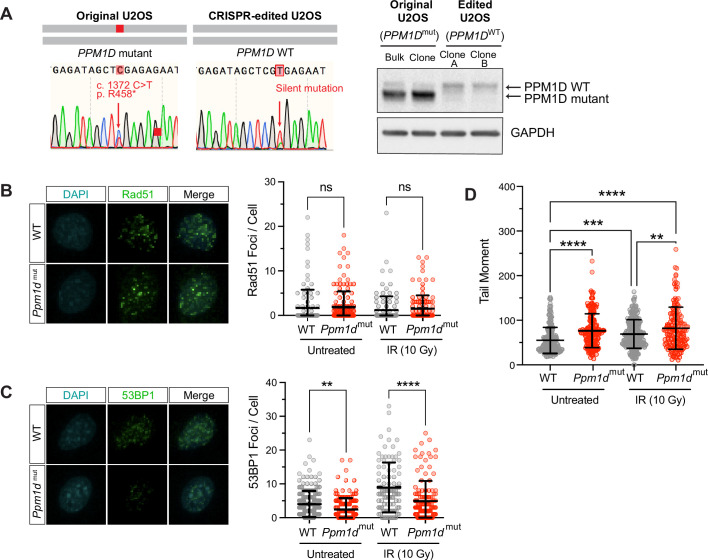
Figure 5—figure supplement 1—source data 1. Western blot analysis of CRISPR-edited U2OS clones validating the correction of the endogenous PPM1D mutations to the wild type form.
Figure 5—figure supplement 1—source data 2. Immunofluorescence microscopy of WT and Ppm1d-mutant mouse embryonic fibroblasts stained with Rad51.
Figure 5—figure supplement 1—source data 3. Immunofluorescence microscopy of WT and Ppm1d-mutant mouse embryonic fibroblasts stained with 53BP1.