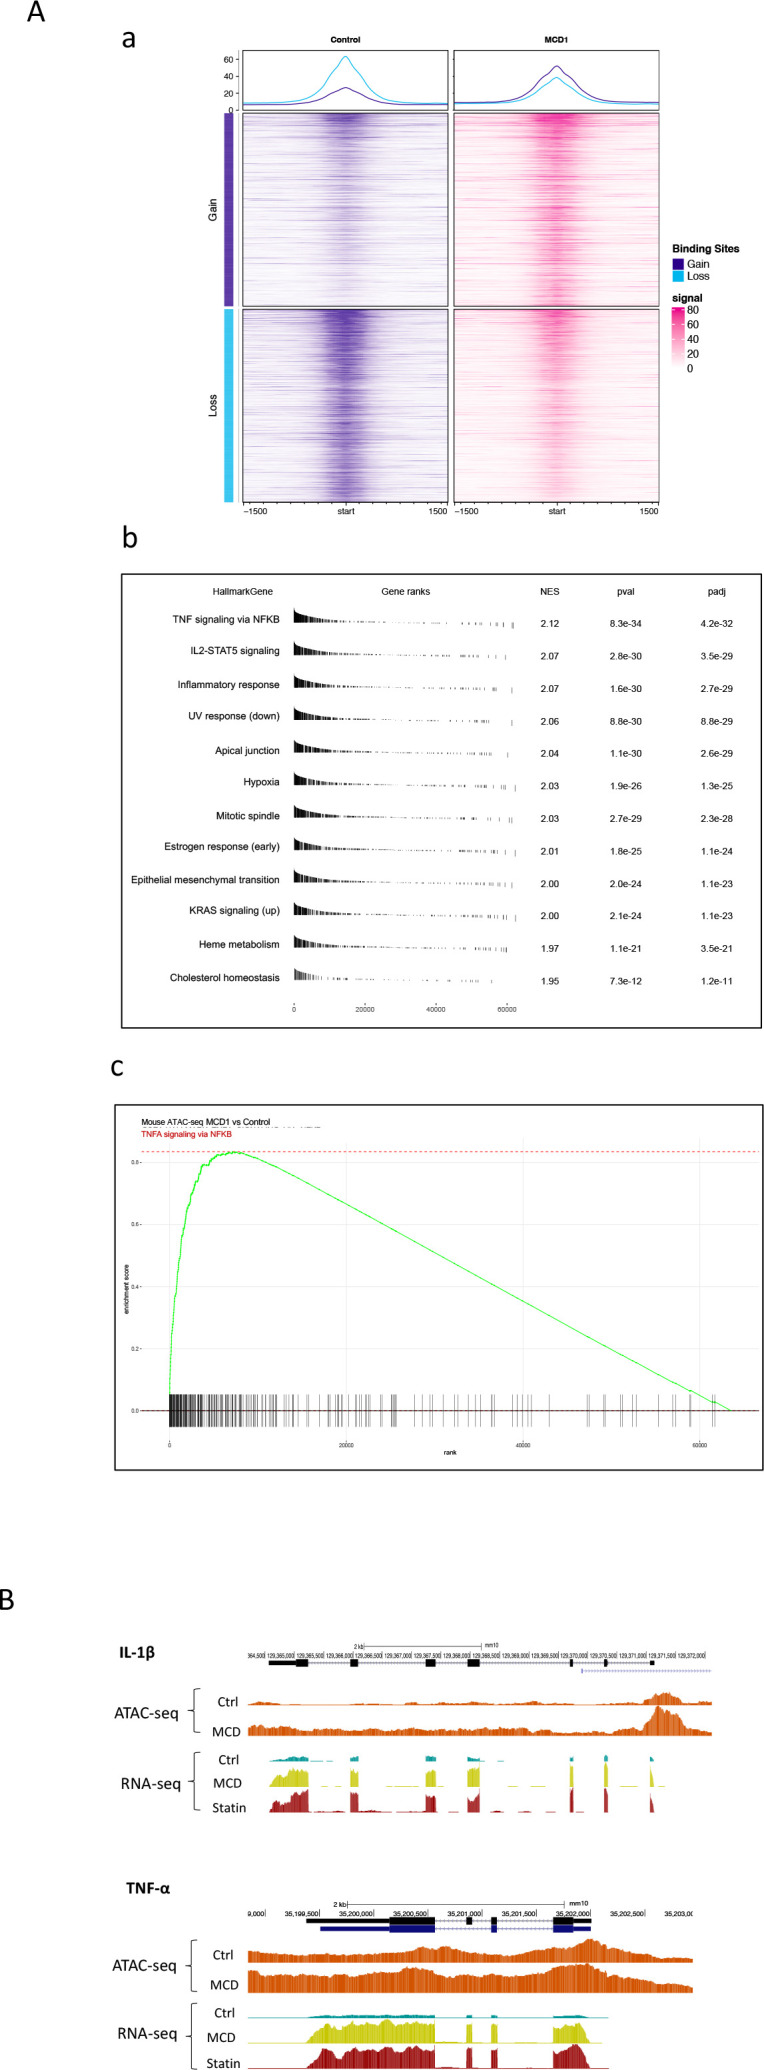
Figure 6. Cholesterol modulates macrophage epigenetic modifications.
(A) ATAC-seq in control and methyl-β-cyclodextrin (MCD) (5 mM, 1 hr) treated RAW 264.7 macrophages. (a) Summit-centered heatmap of differentially accessible ATAC-seq signals. (b) Pathways identified by gene set enrichment analysis (GSEA) of differentially assessable genes in (a). (c) The details of most highly represented pathway, TNFA signaling vis NF-κB. (B) ATAC- and RNA-seq profiles alignment from ATAC- and RNA-seq for the genomic loci of Il1b (top) and Tnfa (bottom).


