Fig. 6.

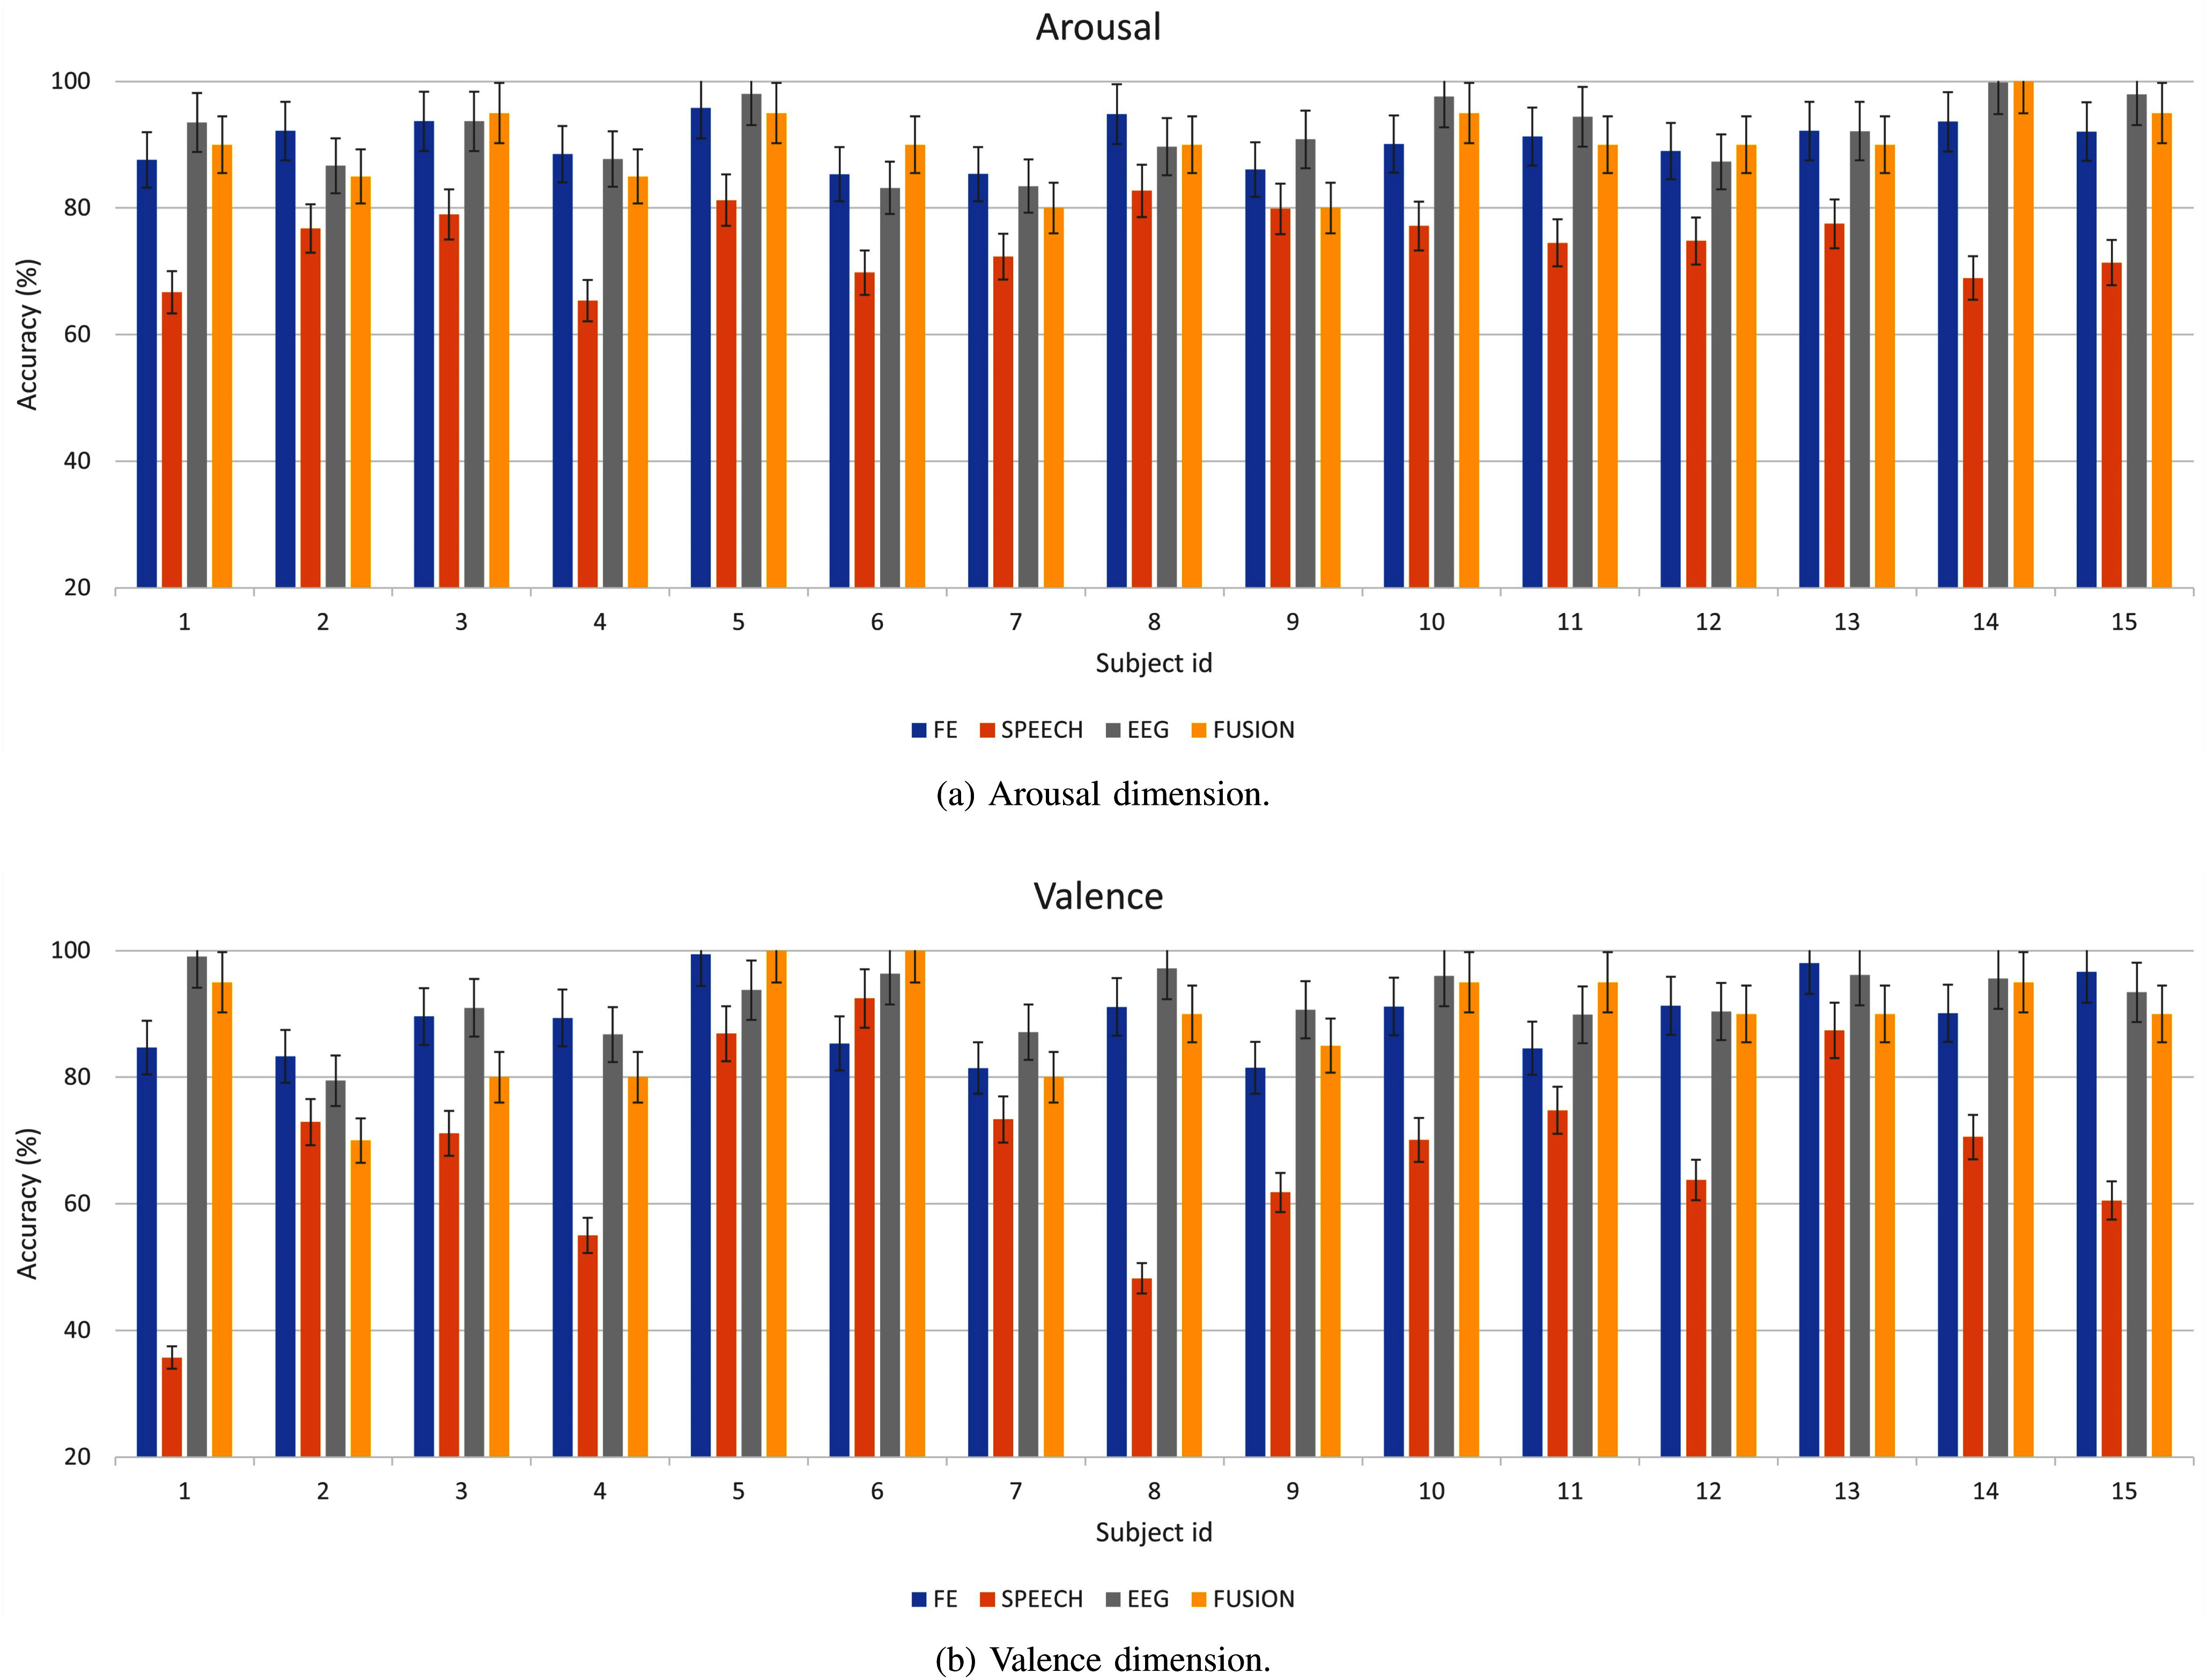
The accuracy of UER and MER for each subject in the MAHNOB-HCI dataset. The horizontal axis represents the subject ID, and the vertical axis represents the accuracy rate ( ). FE: facial expressions.

The accuracy of UER and MER for each subject in the MAHNOB-HCI dataset. The horizontal axis represents the subject ID, and the vertical axis represents the accuracy rate ( ). FE: facial expressions.