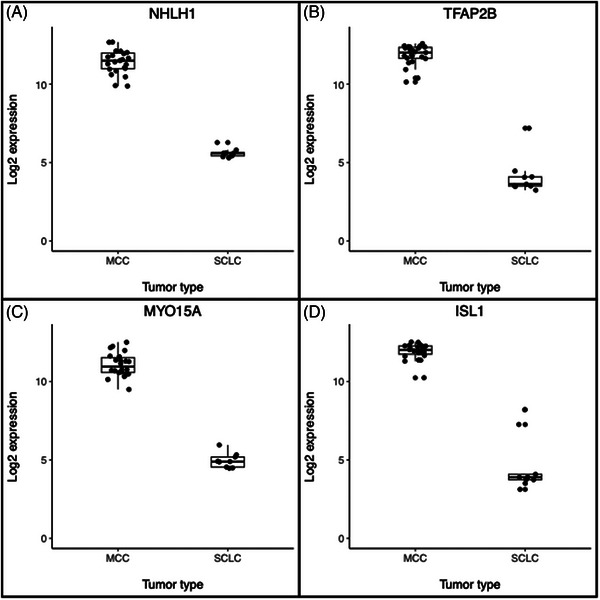
FIGURE 4.

MCC versus SCLC candidate marker gene expression dot plots Gene expression of 4 MCC High candidate genes, NHLH1 (A), TFAP2B (B), MYO15A (C), ISL1 (D) is shown. Each gene showed higher expression in all MCC samples than SCLC samples. Box plots show the median, 75th and 25th percentiles, and 1.5 times the interquartile ranges.
