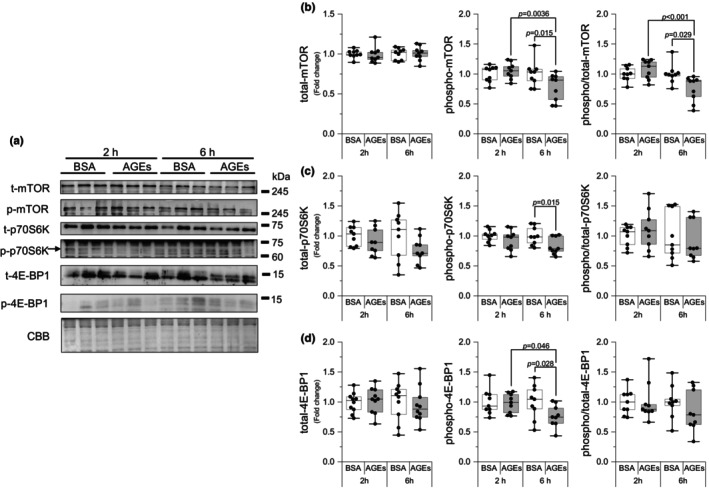
FIGURE 2.

AGEs stimulation reduces the protein synthesis pathway. (a) Representative immunoblots from western blotting. (b) Total mechanistic target of rapamycin (mTOR), phosphorylation of mTOR Ser2448, the ratio of phosphorylation to total mTOR (6 h of AGEs vs. 6 h of BSA, g = 1.34; vs. 2 h of AGEs, g = 1.75). (c) Total 70 kDa ribosomal protein S6 kinase (p70S6K), phosphorylation of p70S6K Thr389, the ratio of phosphorylation to total p70S6K. (d) Total 4E binding protein 1 (4E‐BP1), phosphorylation of 4E‐BP1 Thr37/46, the ratio of phosphorylation to total 4E‐BP1. Data are shown as box plots. Individual data points are indicated on the graph. Statistical significance is analyzed using two‐way ANOVA with simple effects tests. n = 9/group.
