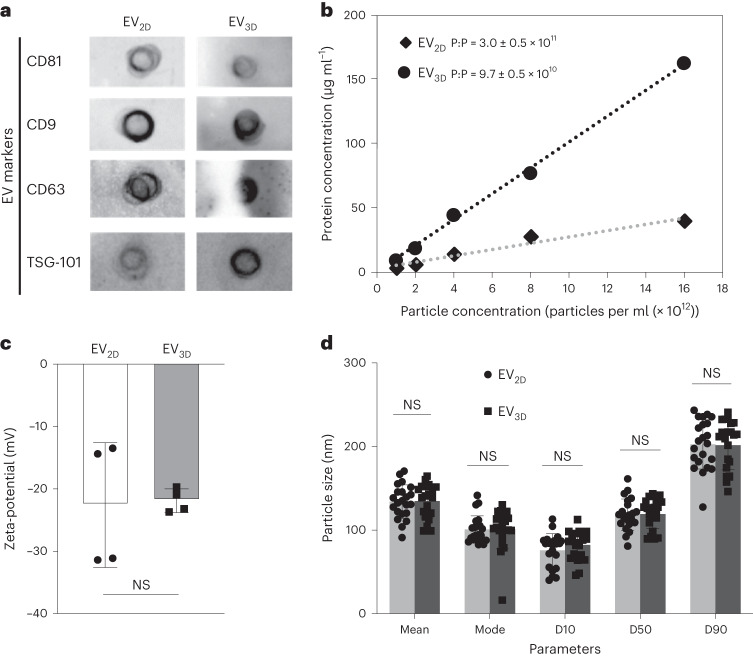
Fig. 1. Physicochemical and biochemical characterization of EV2D and EV3D.
a, Expression of EV surface markers (CD81, CD9, CD63) and internal marker (TSG101) analysed by chemiluminescence dot-blot. Equal numbers of EVs (5 × 10¹⁰ particles per ml) were spotted on the nitrocellulose membrane prior to staining. b, Protein concentration measured by microBCA assay correlated with particle concentration measured by NTA (n = 5). c, Zeta-potential of EVs in deionized water (n = 4, biologically independent samples). Data are presented as mean ± s.d. d, Size of EVs in PBS measured by NTA (n = 22, biologically independent samples). Percentiles (D10, D50 and D90) determine particle size distribution. EV2D and EV3D exhibited comparable physicochemical and biochemical characteristics except for protein content (EV3D > EV2D). Data are presented as mean and mode ± s.d. Statistical analysis was performed by two-tailed unpaired t-test: NS, not significant, P > 0.05.

