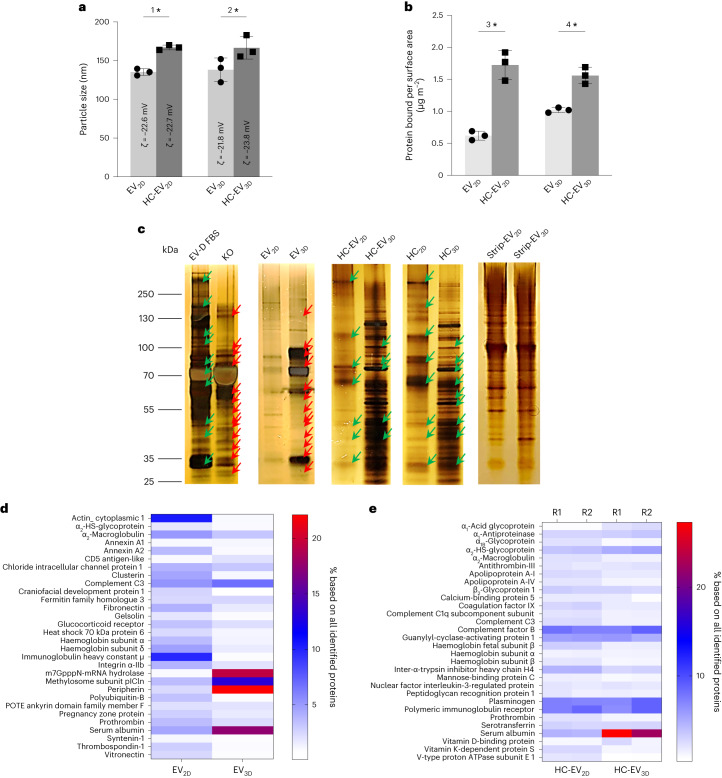
Fig. 2. Protein corona formation on EVs derived from different culturing conditions evaluated by NTA, microBCA assay, SDS–PAGE and LC–MS.
a, Size changes due to protein corona formation (n = 3; 1*P = 0.014, 2*P = 0.019). b, Protein bound per surface area of EVs measured by microBCA assay (n = 3; 3*P = 0.012, and *4P = 0.031). Data are presented as mean ± s.d. Statistical analysis is performed using two-tailed paired t-test (*P < 0.05). c, Representative silver-stained SDS–PAGE of EVs (n ≥ 2), HC-EV, HC and stripped EVs (strip-EV). EV-D FBS and KO are FBS incubation controls and culture media, respectively. Similarities and differences are depicted as green and red arrows, respectively. The results confirmed HC formation of both EV types although the compositions are qualitatively different. d,e, Quantitative LC–MS analysis of protein corona formation. The most abundant proteins in the non-FBS-incubated (d) and FBS-incubated (e) EVs identified by LC–MS against human protein and bovine protein databases, respectively, are displayed in the heatmap (R1 and R2 represent two biological replicates). Both EV3D and HC-EV3D, unlike their 2D counterpart, are rich in albumin. Values are expressed as percentage abundance of total protein amounts identified (n = 2, biological replicates with n = 3, technical replicates per sample).

