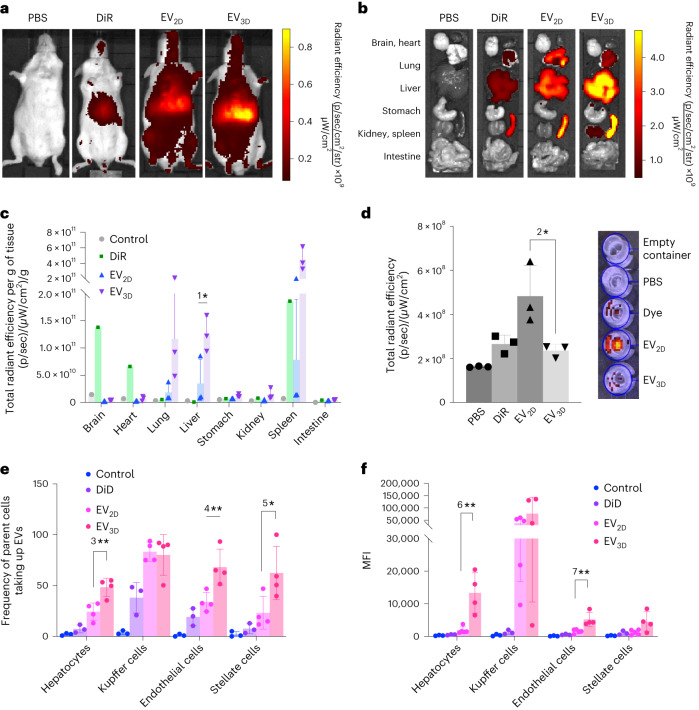
Fig. 4. In vivo organ biodistribution and cellular uptake by liver subpopulations of EVs.
a–d, Animals were intravenously injected with 2 × 10¹¹ DiR-labelled EVs, PBS or the free dye (control): representative whole-body live (ventral) imaging (a), ex vivo images of whole major organs (b), semiquantitative analysis of the ex vivo images (n = 3 for EV samples, 1*P = 0.0464) (c) and urine clearance at 24 h post-injection (n = 3, 2*P = 0.0393) (d). Fluorescence intensity measured as total radiant efficiency per gramme of tissue was obtained by using an ROI tool and Living Image v.4.7.3 software. e,f, Cellular uptake of EVs by liver subpopulations (hepatocytes, Kupffer cells, endothelial cells and stellate cells) by flow cytometry shown as cell number positive for the signals (n ≥ 3, 3**P = 0.0032, 4**P = 0.0089 and 5*P = 0.0371) (e) or MFI (n ≥ 3, 6**P = 0.0014 and 7**P = 0.0033) (d). EV3D showed significantly higher uptake in hepatocytes, endothelial cells and stellate cells but not Kupffer cells. Data are presented as mean ± s.d. with two-tailed unpaired t-test (c,d) and one-way ANOVA with post hoc Tukey test (e,f) (*P < 0.05, **P < 0.01).

