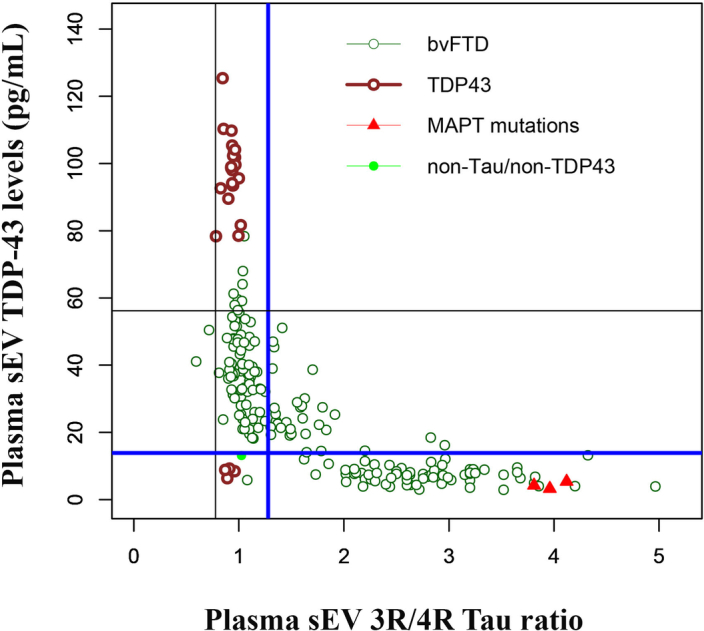
Extended Data Fig. 4. Plasma sEV 3R/4R Tau ratio versus plasma EV TDP-43 levels in bvFTD cases of DESCRIBE subcohort 2.

Genetically or neuropathologically defined bvFTD cases are indicated by the different color-codes. Cut-off values as determined by Gaussian mixture modeling for subcohort 2 (Fig. 4, Supplementary Fig. 15). The two cut-offs for separation of bvFTD into putative TDP-43 and Tau pathology groups are indicated by bold blue lines (sEV 3R/4R Tau ratio cut-off: 1.27; sEV TDP-43 cut-off: 13.87 pg/ml).
