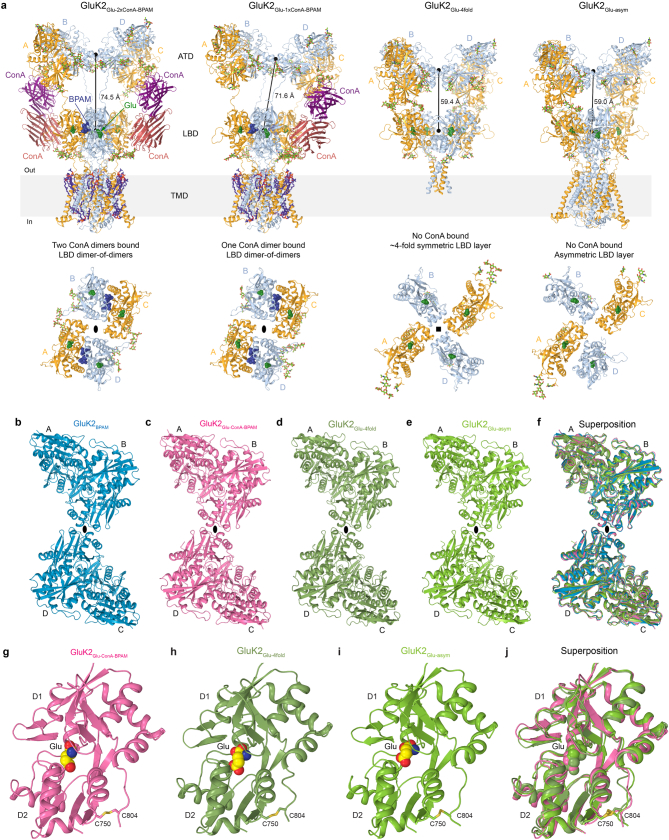
Extended Data Fig. 4. Structural ensemble observed for GluK2 in the presence of Glu, ConA and BPAM and domain comparisons.
a, Structures of GluK2Glu-2xConA-BPAM, GluK2Glu-1xConA-BPAM, GluK2Glu-4fold and GluK2Glu-asym viewed parallel to the membrane (top) and their LBD layers viewed extracellularly (bottom). Subunits A/C colored orange, B/D cyan, and ConA molecules purple and magenta. Molecules of Glu (dark green) and BPAM (dark blue) are shown as space-filling models. Carbohydrates (light green) and lipids (violet) are shown as sticks. The distances between the centers of mass of ATD and LBD layers are indicated. b-f, ATD layer structures from GluK2BPAM (b, PDB ID: 8FWS, blue), GluK2Glu-ConA-BPAM (c, pink), GluK2Glu-4fold (d, smudge), GluK2Glu-asym (e, green) and their superposition (f). g-j, Individual LBD structures from GluK2Glu-ConA-BPAM (g, pink), GluK2Glu-4fold (h, smudge), GluK2Glu-asym (i, green) and their superposition (j).

