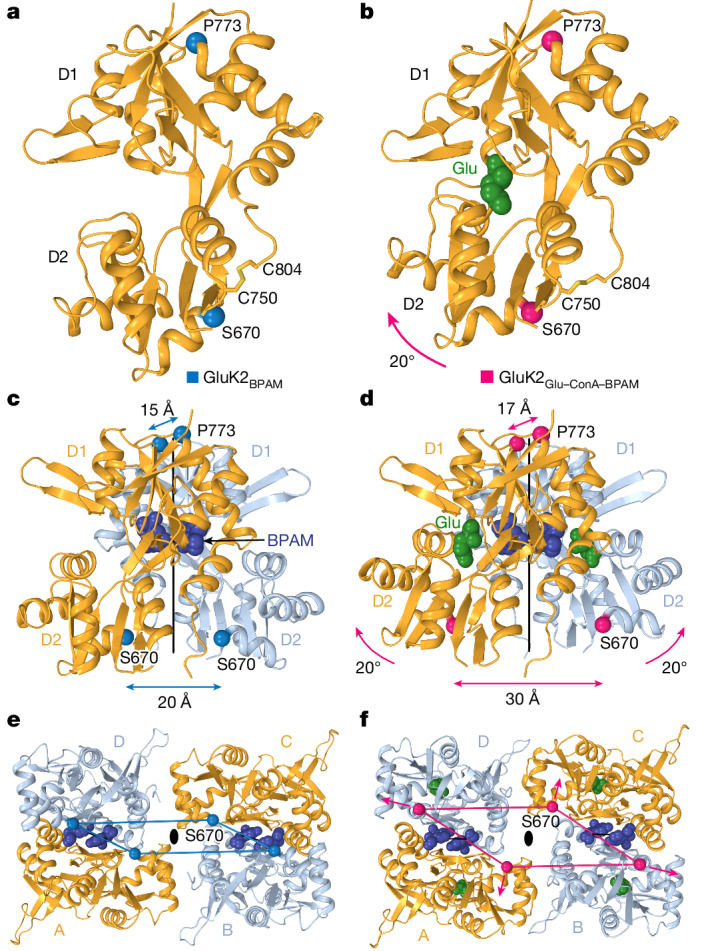
Fig. 3. Comparison of LBDs in GluK2BPAM and GluK2Glu–ConA–BPAM.

a,b, Single LBD in GluK2BPAM (a; Protein Data Bank (PDB) ID: 8FWS) and GluK2Glu–ConA–BPAM (b), with Glu shown as a space-filling model (green) and Cα atoms of S670 and P773 as blue and pink spheres, respectively. The 20° rotation of the lobe D2 towards D1 in GluK2Glu–ConA–BPAM upon Glu binding is illustrated by the pink arrow. c,d, LBD dimers in GluK2BPAM (c) and GluK2Glu–ConA–BPAM (d), with BPAM shown as a space-filling model (dark blue) and the axes of the local two-fold rotational symmetry as continuous black lines. Distances between Cα atoms of S670 and P773 are indicated. e,f, Intracellular view of LBD tetramers in GluK2BPAM (e) and GluK2Glu–ConA–BPAM (f). The Cα atoms of S670 are connected by blue (e) or pink (f) lines and pink arrows illustrate the expansion forces applied to the M3–S2 linkers that induce channel opening.
