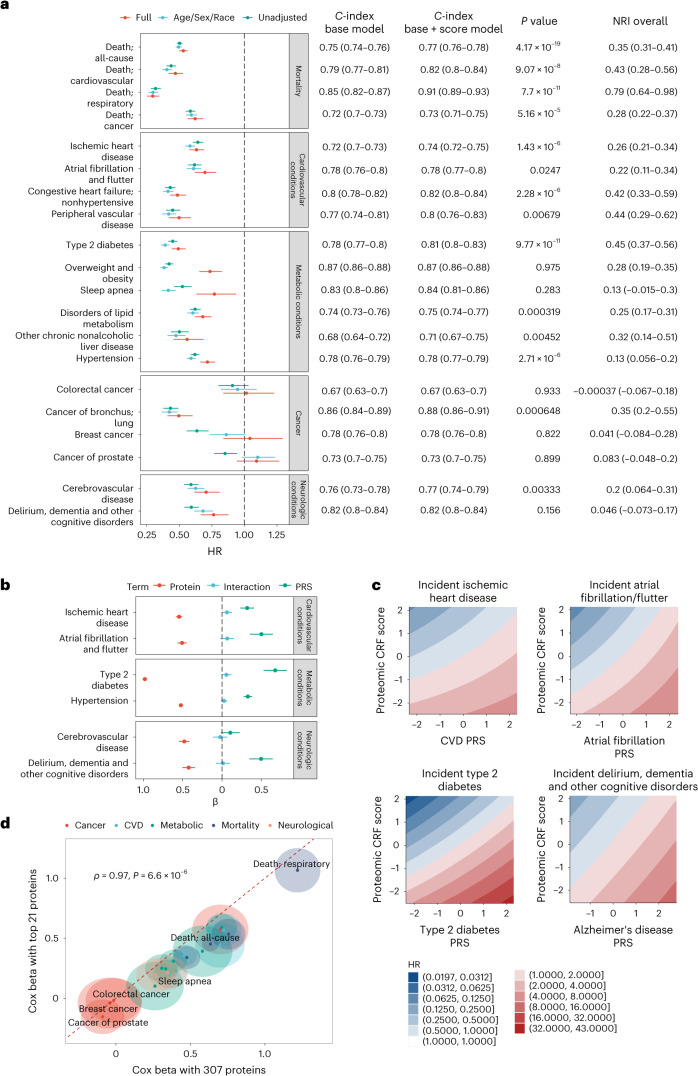
Fig. 3. Proteomic CRF score, polygenic risk and multisystem clinical outcomes.
a, Forest plot of Cox model results with proteomic score as the main predictor, grouped by outcome category. The ‘full’ adjustment model includes adjustment for age, sex, race, BMI, systolic blood pressure, diabetes, Townsend deprivation index, smoking, alcohol and LDL. Error bars, 95% CI. The adjoining table reports the C-index for Cox models without proteomic score (Base) and with the score (Score). Base models include age, sex, race, BMI, systolic blood pressure, diabetes, Townsend deprivation index, smoking, alcohol and LDL. Reported P value is from comparison testing of C-indices by z distribution (two-sided) without correct for multiple comparison. b, Cox beta coefficients from models including an interaction between the protein score of CRF and PRSs of the indicated conditions or diseases. Error bars, 95% CI. c, Contour map of the model predicted HR across the range of protein score of fitness and PRSs. The referent hazard was set at the median of the protein score and median of the PRS. Values reported and visualized are from point estimates and 95% CI. d, Comparison of Cox model coefficients from a parsimonious 21-protein panel and the full 307-protein panel. The halo represents the 95% CI around the model coefficient. P value is from two-sided Spearman rank correlation test. For visualization, we reversed the sign of the beta coefficients. Full data on sample sizes, model estimates and results of statistical testing may be found in Supplementary Tables 7 and 13.

