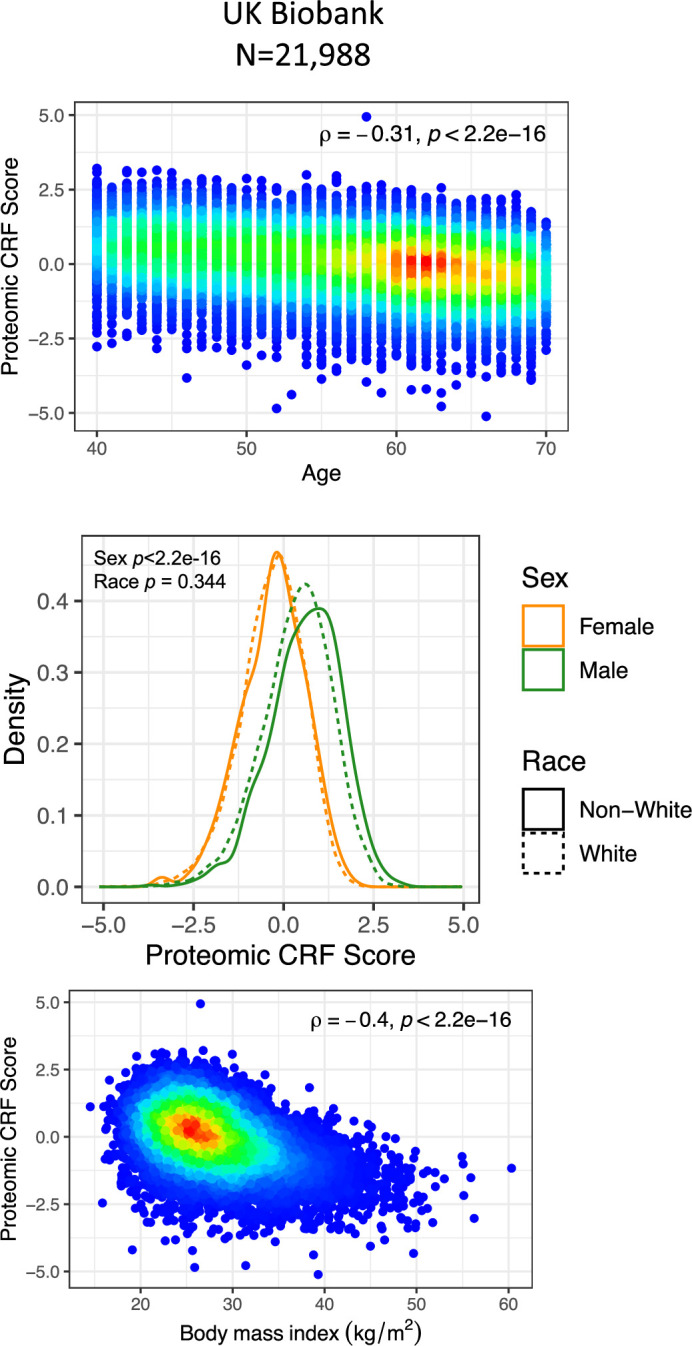
Extended Data Fig. 2. Relations of a protein score of fitness with age, sex, race and BMI in UK Biobank.

Colors on scatter plots represent density of overlapping observations with red being the most dense and blue the least dense. P values on panels showing the relationship of the proteomic CRF score with sex and race are from linear regression models of the proteomic CRF score as a function of sex and race. All other panels report P values from Spearman rank correlation tests. P values below 2.2 × 10⁻¹⁶ are reported as p < 2.2e-16.
