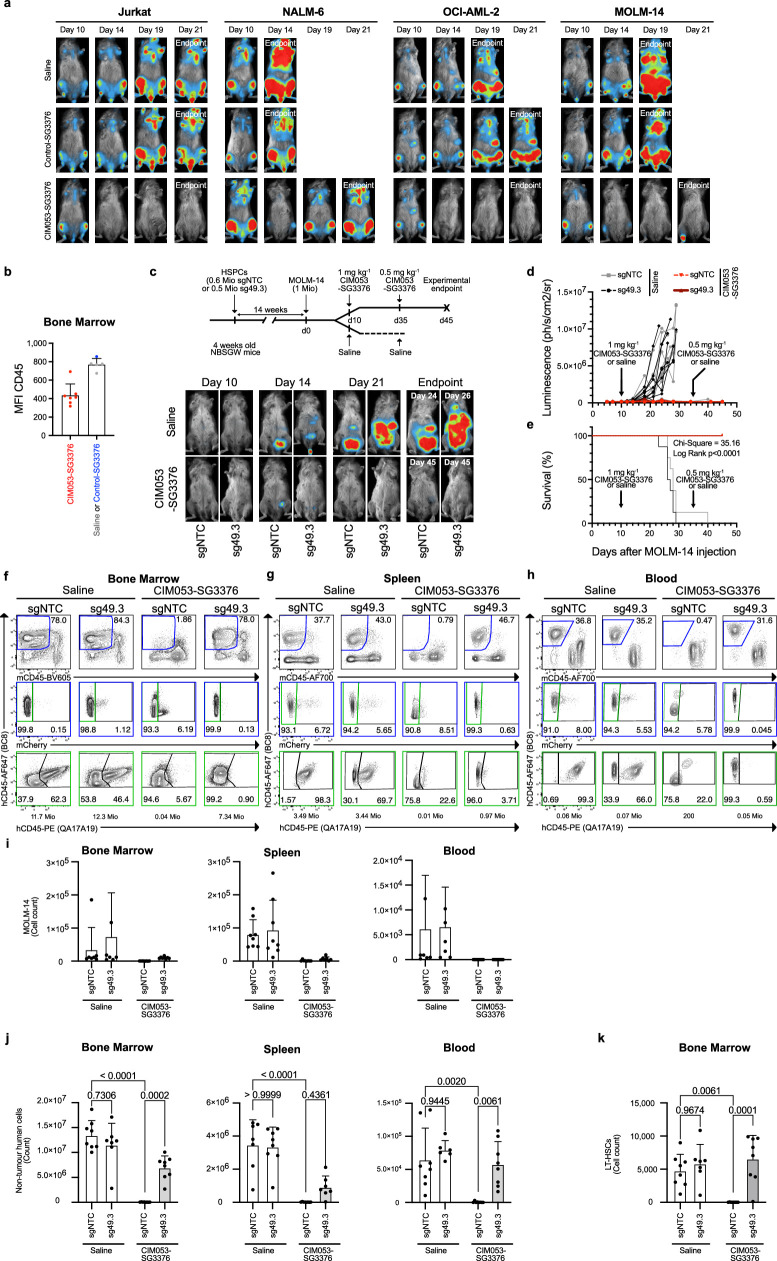
Extended Data Fig. 7. In vivo CIM053-SG3376 mediated tumour treatment with preserved haematopoiesis of edited cells.
a, Images depicting representative mice for each tumour model (Jurkat, NALM-6, OCI-AML-2 and MOLM-14) before treatment (day 10 post tumour injection), day 14, 19 and 21 (endpoint) for each treatment arm (n = 5 mice for saline, 2 for control-SG3376 and 5 for CIM053-SG3376). b, CD45 MFI quantification of bone marrow cells of mice injected with NALM-6 cells and treated with saline, control-SG3376 or CIM053-SG3376 at endpoint. c, Experimental timeline of NBSGW mice humanised with control (sgNTC) or shielded (sg49.3) HSPCs, followed by MOLM-14 tumour xenograft injection. Mice were subjected to saline or CIM053-SG3376 treatment. Lower panels: images of representative mice before treatment (day 10 post MOLM-14 injection), day 14, 21, and at endpoint. d, Luminescence curves of individual mice. e, Survival curve from (c-d). Bone marrow (f), spleen (g) and blood (h) flow cytometry panels showing human chimerism (%BC8+mCD45−, blue gate) of mice humanised with control (sgNTC) or edited (sg49.3) HSPCs and treated with saline or CIM053-SG3376. MOLM-14 cells (BC8+mCherry+) pre-gated on human cells (%BC8+mCD45−, blue gate) are displayed by the middle panels. Edited (%BC8+QA17A19−) and unedited (%BC8+QA17A19+) cells within the non-tumour human population (%BC8+mCherry−, green gate) are shown in the bottom panels. Absolute cell counts of representative panels calculated according to input counting beads are written below each panel. i, Quantification of MOLM-14 cells (%BC8+mCD45−mCherry+) in bone marrow, spleen and blood. j, Quantification of non-tumour human cells (%BC8+mCD45-mCherry−). k, Quantification of long-term haematopoietic stem cells (LT-HSC) (%BC8+mCD45−CD34+CD38−CD90+CD45RA−) in the bone marrow. (In all panels, 6-7 mice in saline groups and 8 mice in CIM053-SG3376 treated groups, plotting mean values +/− SD). (Ordinary two-way ANOVA tests (alpha 0.05) were employed to assess statistical difference between groups).

