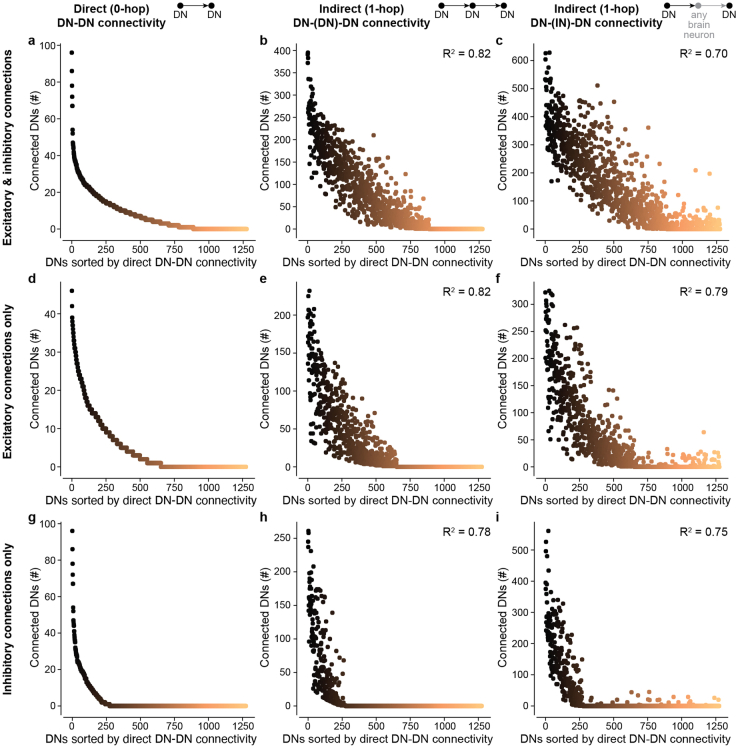
Extended Data Fig. 4. DN-DN connectivity statistics when also including interneurons in the underlying connectome network.
(a) The number of DNs monosynaptically (directly) downstream of every DN, taking into account both excitatory and inhibitory synapses. Data are identical to those in figure 5. (b) The number of DNs disynaptically downstream of each DN, allowing for at most one additional intervening DN. Sorting of the x axis identical to panel (a). Correlation coefficient compares the distributions of panels (a) and (b). (c) The number of DNs disynaptically downstream of each DN, allowing for at most one additional intervening interneuron of any type. Sorting of the x axis identical to panel (a). Correlation coefficient compares the distributions of panels (a) and (c). (d-f) Identical to panels (a-c) but restricted only to excitatory connections between individual neurons. Sorting of the x axis identical in panels (d-f). (g-i) Identical to panels (a-c) but restricted only to inhibitory connections between individual neurons. Sorting of the x axis identical in panels (g-i).

