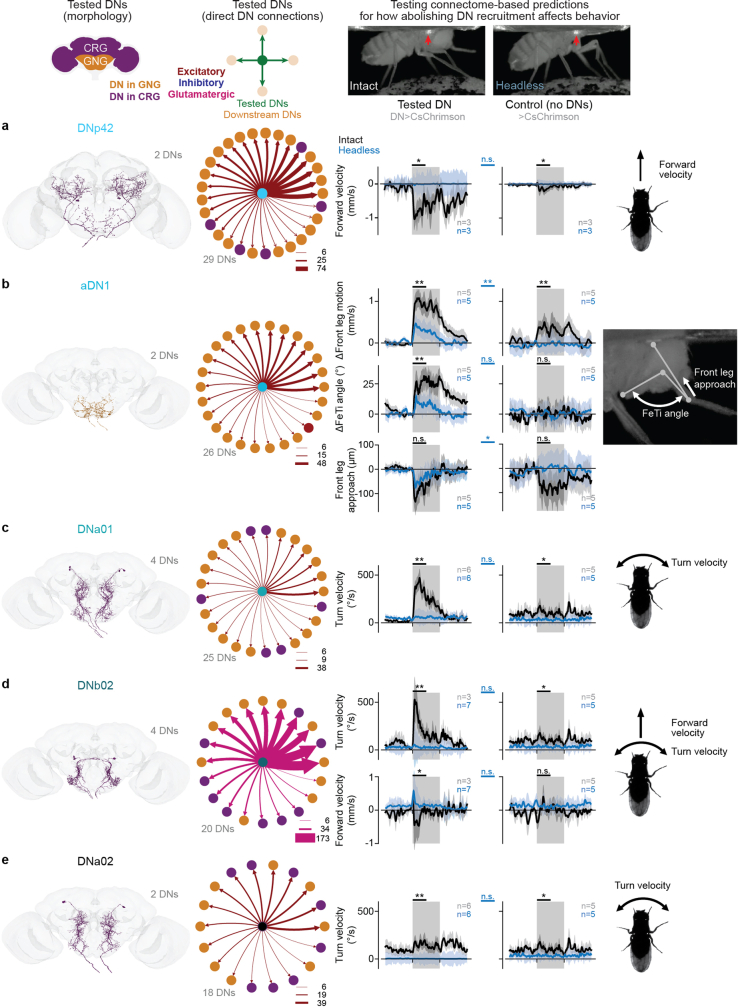
Extended Data Fig. 5. Testing the connectome-based prediction for broadcaster DNs that behaviors depend strongly on downstream DNs.
(a-e)(first column) The morphology of tested DNs in the adult female brain connectome. DNs are color-coded based on their somata localization within the cerebral ganglia (purple) or gnathal ganglia (orange). The number of DNs is indicated. (second column) A network schematic of direct connections from tested to downstream DNs. Edge widths reflect the number of synapses and is consistent across plots. Edge colors denote excitatory (red), inhibitory (blue), or glutamatergic (pink) which can be excitatory or inhibitory depending on receptor type60. (third column) Quantitative analyses of optogenetically-driven behaviors and movements in intact (black traces) and headless animals (blue traces). The number of flies for each condition are indicated. Each fly is optogenetically stimulated ten times. Thus, the average and 95% confidence interval of the mean for a total of n*10 trials is shown. (fourth column) Identical behavioral analysis for control flies without DN opsin expression. Note that controls for different parameters include the same five animals. Two-sided Mann-Whitney U tests comparing the trial mean of intact and headless animals (black bars, above each plot) and comparing headless experimental with headless control flies (blue, in between experimental and control plots) are shown (*** means p < 0.001, ** means p < 0.01, * means p < 0.05, n.s. means p≥0.05; for exact p-values see Supplementary Table 5). (fifth column) An illustration of the behavioral parameter(s) being quantified. (a) DNp42 has monosyaptic connections to 29 other DNs and triggers backing up in intact animals64. This behavior is not observed in headless flies, as quantified by fictive forward walking velocity. (b) aDN1 has monosynaptic connections to 26 other DNs and triggers grooming in intact animals. By contrast, headless animals produce mostly uncoordinated front leg movements. These occur more slowly at a lower frequency (top) with a smaller change in femur-tibia angle (middle). The ‘front leg approach’ to the head—the change in Euclidean distance between the neck and tibia-tarsus joint relative to 1 s before stimulus onset—is similar between intact and headless animals (bottom). (c) DNa01 has monosynaptic connections to 25 other DNs and triggers in place turning. This is quantified as an increase in turn velocity. This behavior is lost in headless animals. (d) DNb02 has monosynaptic connections to 20 other DNs and weakly triggers turning. This is quantified as an increase in turning velocity (top), a phenotype that is lost in headless animals. Instead, a flexion of the front legs can be observed in headless animals. This is quantified as a short spike in forward velocity (bottom). These data partially overlap with those in Fig. 5d–g. (e) DNa02 has monosynaptic connections to 18 other DNs and weakly triggers turning. This is quantified as an increase in turning velocity. This behavior is lost in headless animals.

