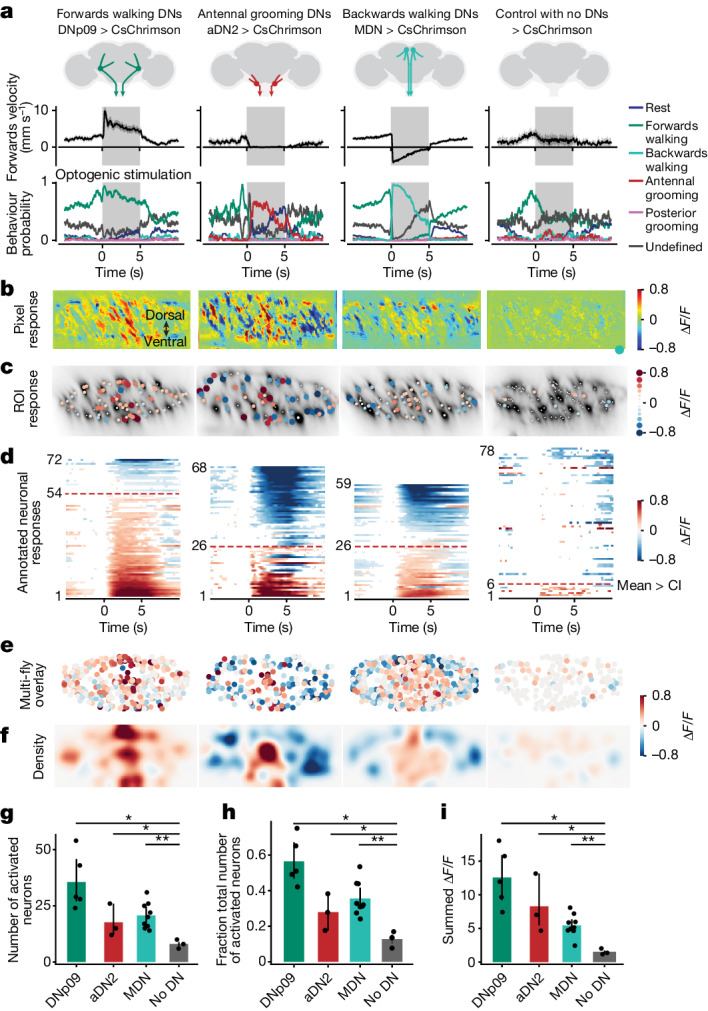
Fig. 2. Activation of comDNs recruits larger, distinct DN populations.

Optogenetic stimulation of comDNs: DNp09 (forwards walking, n = 5 flies, 120 stimulation trials), aDN2 (antennal grooming, n = 3 flies, 34 trials) and MDN (backwards walking, n = 9 flies, 271 trials). Control: no DN expression (n = 3 flies, 47 trials). a, Forwards walking velocities (top) and the probability of classified behaviours (bottom) during optogenetic stimulation (grey bar). b, Images illustrating GNG DN population activity upon comDN stimulation. For each, one representative animal is shown (as in Supplementary Video 1; n = 33, 10, 97 and 10 trials for DNp09, aDN2, MDN and control flies, respectively). The same flies are shown in panels c,d. c, Single-neuron responses to DN stimulation. Circles are scaled or colour coded to represent the maximum change in fluorescence (normalized ΔF/F) of one detected DN axon or region of interest (ROI). The small white dots indicate responses smaller than the 95% CI of the trial mean. d, Trial-averaged single ROI responses across time, ordered by response magnitude. Response magnitude is colour coded or white if smaller than the 95% CI. The red dashed line indicates the number of activated ROIs (that is, positive response larger than the 95% CI). e,f, A registered overlay (e) or density visualization (f) of the data from multiple flies analysed as in c. The number of flies or trials is identical to a. g–i, Statistical comparison of the number of activated ROIs (that is, red dashed line in d) (g), the fraction of activated ROIs (that is, divided by the number of visible ROIs) (h) and the strength of activation (that is, the sum of the normalized ΔF/F for positively activated neurons) (i) using two-sided Mann–Whitney U-tests (n as in a; P values for each comparison to control: DNp09 = 0.018, aDN2 = 0.040 and MDN = 0.008). The shaded areas in a and the error bars in g–i represent 95% CI of the mean. ***P < 0.001, *P < 0.05.
