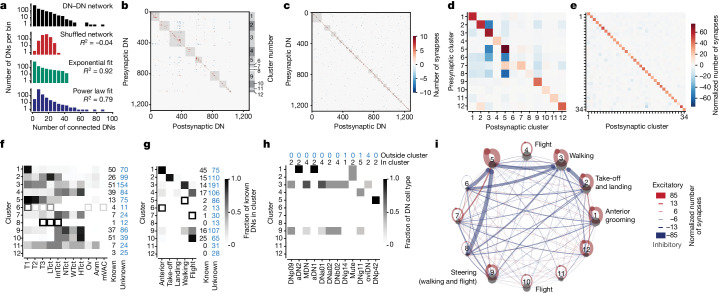
Fig. 6. Networks of DNs for similar behaviours excite one another and inhibit those for other behaviours.
a, The connectivity distribution of the DN–DN network (black), the same data after shuffling individual connections (red), the best exponential fit (green) or the best power law fit (blue). b, DN–DN connectivity clusters (grey squares) indicating excitatory (red) and inhibitory (blue) connectivity between presynaptic DNs (rows) and postsynaptic DNs (columns). The numbers on the right side indicate cluster numbers in d,f–i. c, As in b, but for a network with shuffled DN–DN connectivity. d, The number of synapses (excitatory minus inhibitory) between any two clusters normalized by the number of DNs in the postsynaptic cluster. e, As in d, but for the shuffled network in c. f, Fraction of known DNs within each cluster projecting to different VNC neuropil regions. Anm, abdominal neuromere; HTct, haltere tectulum; IntTct, intermediate tectulum; LTct, lower tectulum; mVAC, medial ventral association centre; NTct, neck tectulum; Ov, ovoid; T1–T3, leg neuropils; WTct, wing tectulum. Data are from ref. 13. g, Fraction of known DNs within each cluster associated with distinct behaviours. Data are taken from the literature (Supplementary Table 8). Open squares indicate clusters containing fewer than five known DNs (f,g). h, The distribution of experimentally investigated DNs across DN clusters. i, A network visualization of clusters in d with associated behaviours from g. There are predominantly excitatory (red) connections within each DN cluster and inhibitory (blue) connections between clusters.

