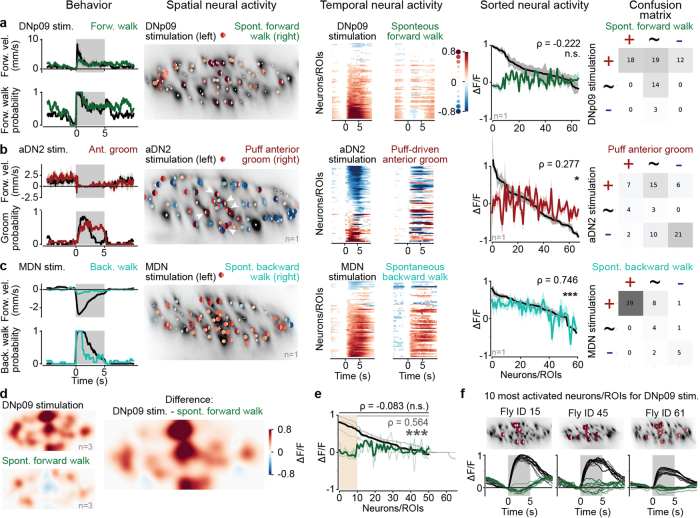
Extended Data Fig. 2. Comparison of GNG-DN population neural activity during optogenetic stimulation versus corresponding natural behaviors.
(a-c) For (a) DNp09 and forward walking, (b) aDN2 and anterior grooming, or (c) MDN and backward walking: (left) behavioral responses to optogenetic stimulation of command-like DNs (black) versus natural occurrences of the behavior in question (color); (middle left) single neuron/ROI responses (analyzed as in Fig. 2c). Here the left half-circle reflects the response to optogenetic activation and the right half-circle the activity during natural behavior; (middle) single neuron average responses as in Fig. 2d; (middle right) Comparing the activity of individual neurons between optogenetic stimulation (black) and natural behavior (color). Neurons/ROIs are sorted by the magnitude of their responses to optogenetic activation. Shaded areas indicate 95% confidence interval of the mean across trials. Pearson correlation between optogenetic and spontaneous response and significance of test against null-hypothesis (the two variables are uncorrelated, see Methods) are shown; (right) Confusion matrix comparing the number of active neurons/ROIs that were more active (+), similar (~), or less active (−) upon optogenetic stimulation versus during natural behavior. (a) DNp09: for one fly n=23 optogenetic stimulation trials (not forward walking before stimulus) and 28 instances of spontaneous forward walking in which the fly was not walking forward for at least 1 s and then walking forward for at least 1 s (correlation: ρ = − 0.022, p = 0.356, N = 66 neurons, two-sided test, see Methods). (b) aDN2: for one fly, n = 20 optogenetic stimulation trials (pre-stimulus behavior not restricted) and 16 instances of anterior grooming elicited by a 5 s humidified air puff (correlation: ρ = 0.277, p = 0.022, N = 68 neurons, two-sided test, see Methods). Indicated are central neurons/ROIs with strong activation during aDN2 stimulation of the neck cervical connective as in Fig. 2f. (c) MDN: for one fly, n = 80 optogenetic stimulation trials (pre-stimulus behavior not restricted) and 21 instances of spontaneous backward walking on a cylindrical treadmill in which the fly was not walking backward for 1 s and then walked backward for at least 1 s (correlation: ρ = 0.746, p < 0.001, N = 60 neurons, two-sided test, see Methods). (d) Density visualisation (as in Fig. 2f) of neural responses to DNp09 stimulation and spontaneous forward walking across three animals. The difference in responses is primarily localized to the medial but not lateral regions of the connective. To maximize comparability, only trials where the fly was not walking forward before stimulus onset were selected. (e) Same plot as in a, middle right but for three animals with DNp09 stimulation and forward walking. Indicated are the correlation values when including (ρ = − 0.083, p = 0.564, n = 172 neurons across three flies, two-sided test, see Methods) or excluding (ρ = 0.564, p < 0.001, n = 142 neurons across three flies, two-sided test, see Methods) the ten neurons most activated by optogenetic stimulation (orange region). (f) The locations of ten neurons indicated in e within the connective of three flies (top) and their single neuron responses to optogenetic stimulation (bottom, black traces) or during natural backward walking (bottom, green traces).

