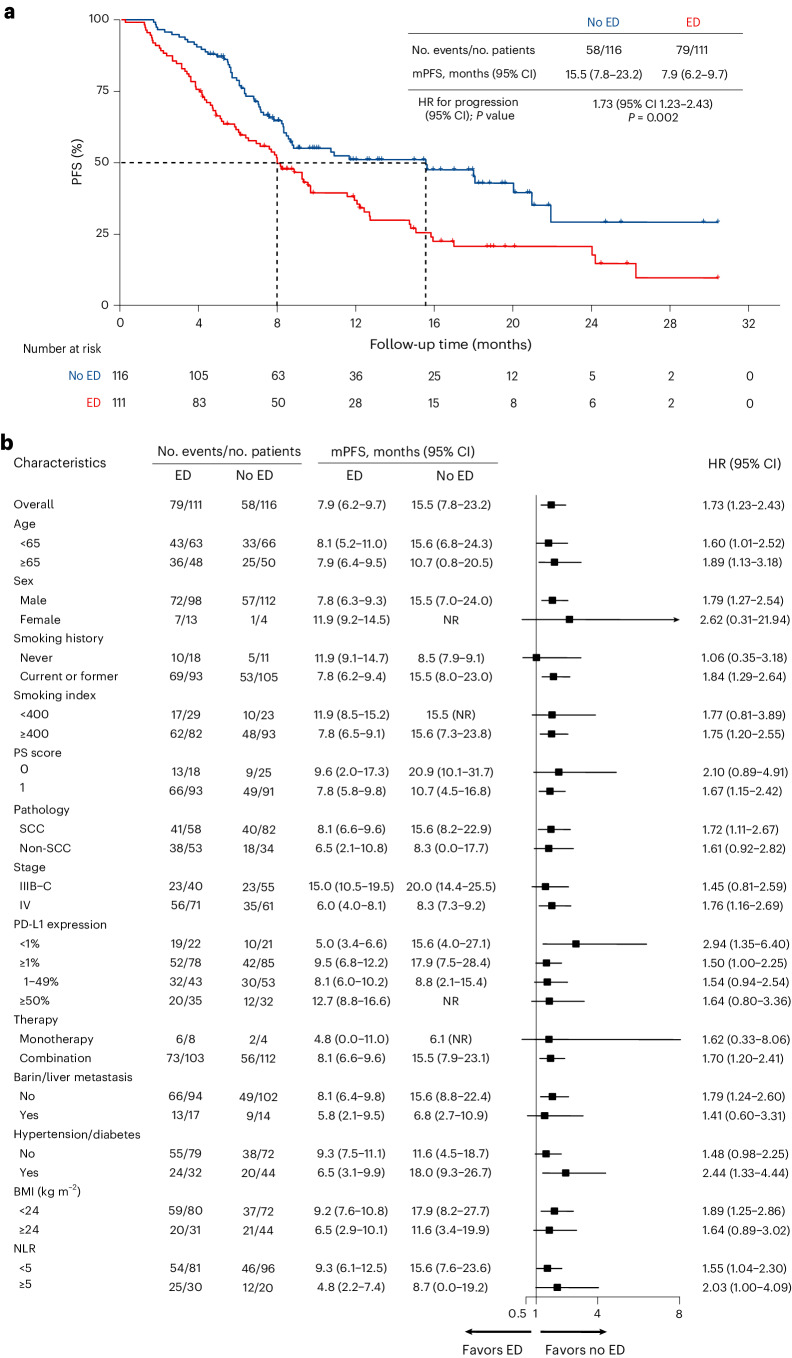
Fig. 2. Kaplan–Meier curve and subgroup analysis of investigator-assessed PFS by baseline ED.
a, Investigator-assessed PFS in the ED and no ED group. P values were calculated using a two-sided log-rank test. The HR and the corresponding 95% CI were calculated using a Cox proportional-hazards regression. b, The forest plots show HR and 95% CI of the subgroup analysis of PFS. Data are presented as the HR with error bars showing 95% CI. mPFS, median PFS; NR, not reached; SCC, squamous carcinoma.

