
Fig. 3. Kaplan–Meier curve of investigator-assessed PFS by baseline ED after propensity score analyses.
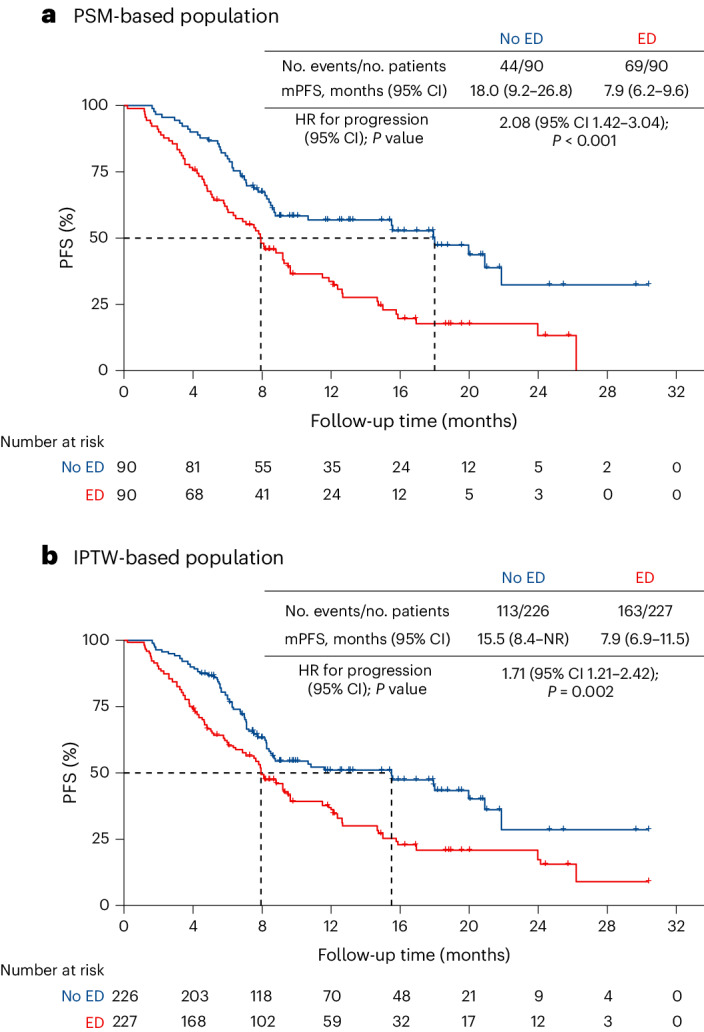
a, Population based on PSM analysis. The exact P value was 0.0002. b, Population based on IPTW. In a and b, the final covariates were sex and pathology for PSM and IPTW, which were independently associated with ED on the basis of the multivariable logistic regression model. P values were calculated using a two-sided log-rank test. No adjustment was made for multiple comparisons. mPFS, median PFS.