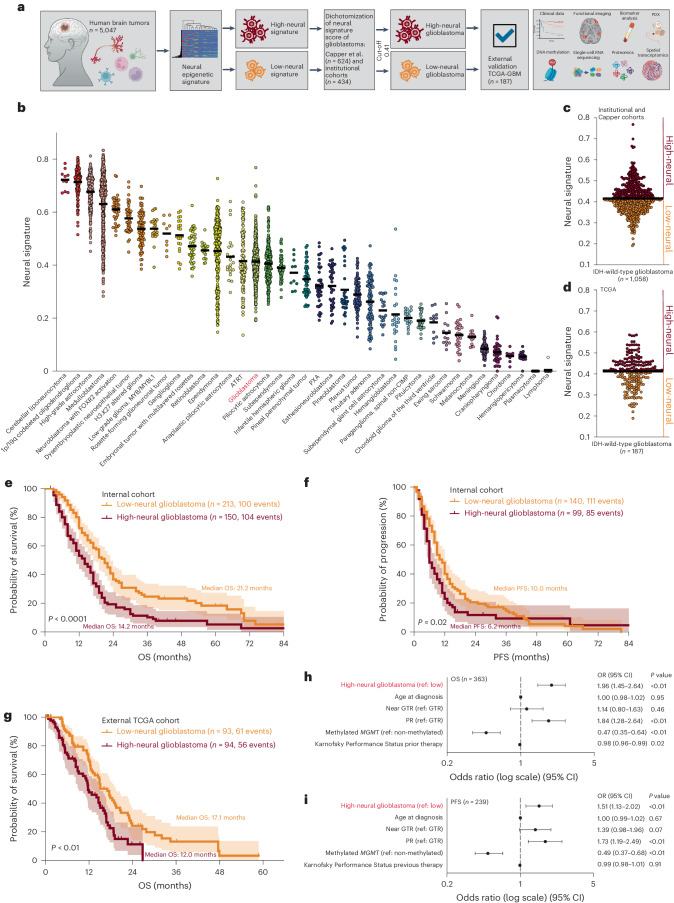
Fig. 1. Epigenetic neural classification predicts outcome of patients with glioblastoma.
a, Schematic of the study workflow. In humans (n = 5,047) diagnosed with a CNS tumor we performed deconvolution using DNA methylation arrays (850k or 450k) for determining the neural signature. IDH-wild-type glioblastomas were stratified into subgroups with a low- or high-neural signature for further analyses. b, Epigenetic neural signature in all CNS tumor entities (n = 5,047). c, Dichotomization of the combined dataset from Capper et al.18 and three institutional cohorts (Hamburg, Berlin and Frankfurt, all Germany) into low- and high-neural glioblastomas. The black line indicates a median neural score of all included patients with glioblastoma (n = 1,058) and represents the cutoff (0.41) for stratification into low- and high-neural glioblastoma. d, External validation of the cutoff value using the TCGA-GBM dataset (n = 187). The black line indicates the median neural score. e–i, Survival analysis of patients with low- and high-neural glioblastoma treated by radiochemotherapy after surgery. e, Overall survival (OS) of 363 patients with glioblastoma of the internal clinical cohort. log-rank test, P = 0.000005. Error bands represent 95% CI. f, PFS of 226 patients with glioblastoma of the internal clinical cohort. log-rank test, P = 0.0233. Error bands represent 95% CI. g, Overall survival of 187 patients with glioblastoma of the TCGA-GBM cohort. log-rank test, P = 0.0017. Error bands represent 95% CI. h,i, Forest plots illustrating multivariate analysis of patients with glioblastoma from the internal clinical cohort. Means are shown by closed circles and whiskers represent 95% CI. GTR, gross total resection; PR, partial resection; MGMT, O6-methylguanine-DNA-methyltransferase.

