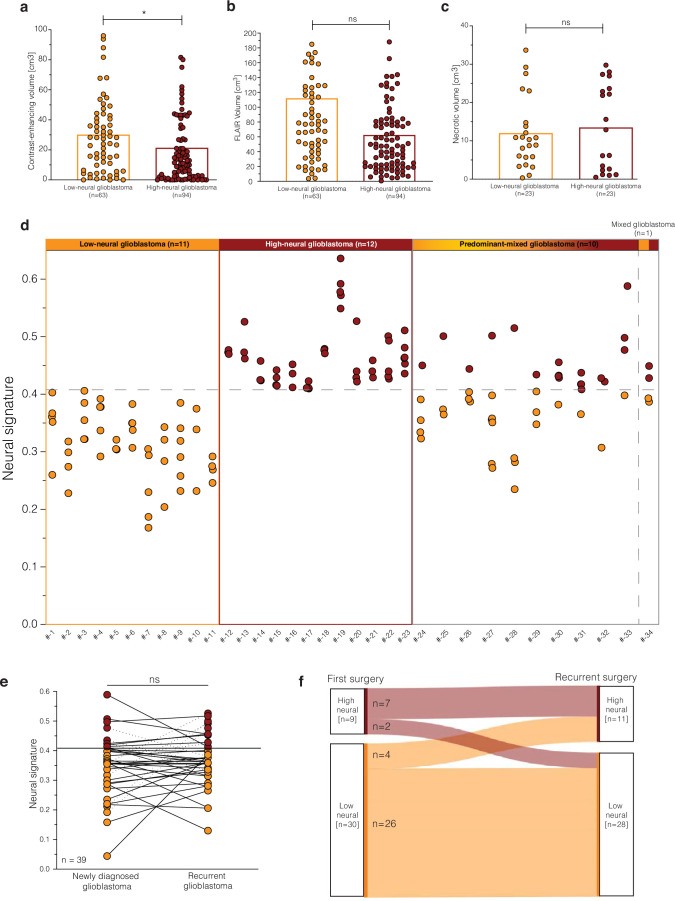
Extended Data Fig. 6. Radiographic parameters and spatiotemporal tumor sampling.
a – c). Association of neural glioblastoma group with volume of a). contrast enhancement, b). FLAIR, and c). tumor necrosis measured by preoperative magnetic resonance imaging. A) P = 0.0374, b) P = 0.1767, and c) P = 0.6373, two-tailed Student’s t-test. d). Analysis of intertumoral difference of neural signature within 34 newly diagnosed glioblastomas with spatial collection of 3 to 7 samples per tumor. 23 (67.6 %) of these tumors had a pure low- or high-neural signature in all individual biopsies with additional 10 (29.4 %) tumors being predominantly low or high. e). Neural signature in 39 patients with matched tumor tissue obtained from surgery at first diagnosis and recurrence. ns: P > 0.05, two-tailed Student’s t-test. f). Sankey plot illustrating a potential switch of the neural subgroup between first diagnosis and recurrence.

