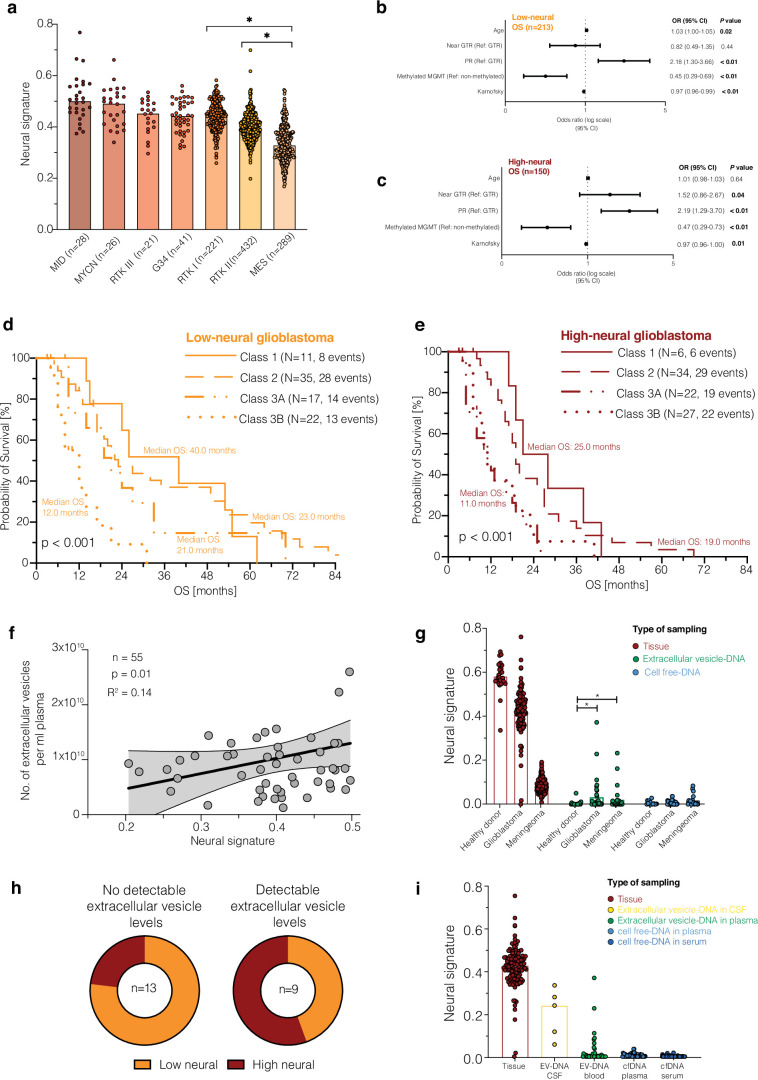
Extended Data Fig. 8. Clinical prognostic and circulating biomarkers of epigenetic neural glioblastomas.
a). Neural signature in DNA methylation subclasses of newly diagnosed IDH-wild-type glioblastoma. *P < 0.05, two-tailed Student’s t-test. b). Forest plot illustrating the multivariate analysis of low-neural patients with glioblastoma. Means are shown by closed circles and whiskers representing the 95% confidence interval. Cox proportional hazards regression model. c). Forest plot illustrating the multivariate analysis of high-neural patients with glioblastoma. Means are shown by closed circles and whiskers representing the 95% confidence interval. Cox proportional hazards regression model. d – e). Survival outcome categorized after RANO categories for extent of resection in patients with glioblastoma treated by radiochemotherapy with a low- and high-neural signature. Class 1: 0 cm3 CE + ≤5 cm3 nCE tumor, Class 2: ≤1 cm3 CE, Class 3A: ≤5 cm3 CE, Class 3B: ≥5 cm3. Log-rank test, d) P = 0.0002, and e) P = 0.0011. f.) Correlation of neural signature and number of extracellular vesicles in patient serum at time of diagnosis. Simple linear regression P = 0.01. Error bands representing the 95% confidence interval. g.) Comparison of neural signature in healthy individuals, patients with glioblastoma, and meningeoma patients between matched tumor tissue, extracellular vesicle-associated DNA in serum, and cell-free DNA in serum. *P < 0.05, two-tailed Student’s t-test. h.) Comparison of patients with no detectable (left panel) and detectable (right panel) extracellular vesicle levels in serum stratified to their epigenetic neural glioblastoma type. i.) Illustration of the neural signature in different types of sampling in patients with glioblastoma.

