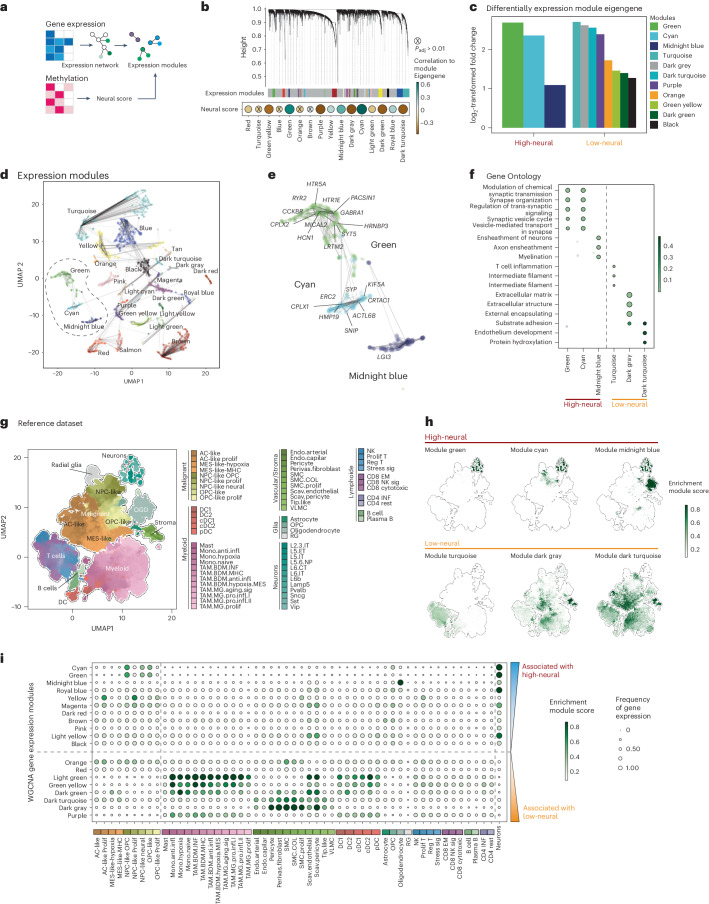
Fig. 2. Integrated epigenetic and transcriptomic analysis reveals synaptic functions and a malignant NPC/OPC-like character in high-neural glioblastoma.
a, Illustration of the workflow to integrate epigenetic and transcriptional data. Gene co-regulation networks are correlated to the epigenetic deconvolution signature. b, Hierarchical dendrogram of the gene expression modules derived from the weighted correlation network analysis. Dot-plot of the neural signature with gene expression models using Pearson correlation (bottom). Size and color indicate the correlation coefficient, nonsignificant correlation is marked. c, Bar-plot of the differential gene expression of module eigengenes (log2-transformed fold change) in low- and high-neural glioblastoma (cutoff 0.41). d, Dimensional reduction (UMAP) of the gene expression modules (named by colors). e, A detailed visualization of the modules: green, cyan and midnight blue (significantly associated with high-neural tumors). f, Gene Ontology analysis of gene expression modules in low- and high-neural tumors. g, UMAP dimensional reduction of the GBMap reference dataset. Colors indicate the different cell types. h, Module eigengene expression of low- and high-neural glioblastoma in the GBMap reference dataset. i, Gene expression enrichment of low- and high-neural-associated module eigengenes across glioblastoma cell states. AC, astrocytes; DC, dendritic cells; GBM, glioblastoma; NK, natural killer; OGD, oligodendrocytes; TAM, tumor-associated macrophages.

