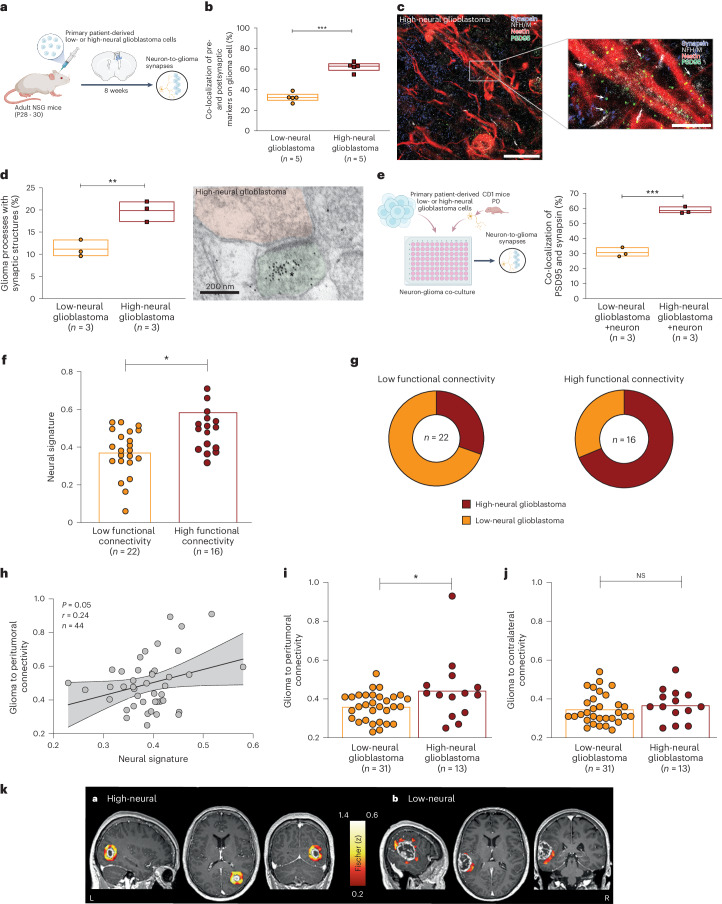
Fig. 4. High-neural glioblastomas are integrated into neuron-to-glioma networks.
a, Experimental workflow. b, Quantification of the colocalization of presynaptic and postsynaptic markers in low-neural (n = 22 regions, five mice) and high-neural (n = 21 regions, five mice) glioblastoma xenografts. P = 0.0008, two-tailed Student’s t-test. Data are mean ± s.e.m. c, Confocal image of infiltrated whiter matter of high-neural glioblastoma xenograft. White box and arrowheads highlight magnified view of synaptic puncta colocalization. Blue, synapsin-1 (presynaptic puncta); white, neurofilament heavy and medium (axon); red, nestin (glioma cell processes); green, PSD95 (postsynaptic puncta). Scale bars, 500 μm (top) and 250 μm (bottom). d, Electron microscopy of red fluorescent protein (RFP)-labeled glioblastoma cells. Quantification of neuron-to-glioma synaptic structures as a percentage of all visualized glioma cell processes (left) and image of neuron-to-glioma process in a high-neural glioblastoma xenograft (right). Asterix denotes immunogold particle labeling of RFP. Postsynaptic density in RFP+ tumor cell (green), synaptic cleft and vesicles in presynaptic neuron (red) identify synapses. **P < 0.01, two-tailed Student’s t-test. Scale bar, 200 nm. Data are mean ± s.e.m. n = 3 biological replicates. e, Colocalization of PSD95 and synapsin-1 in low- and high-neural glioblastoma cells in co-cultures with neurons. P = 0.0007, not significant (NS), P > 0.05, two-tailed Student’s t-test, n = 3 biological replicates. Data are mean ± s.e.m. f, Neural signature categorized into low functional connectivity (LFC) and high functional connectivity (HFC) as defined by magnetoencephalography. P = 0.0327, two-tailed Student’s t-test. g, Overlap between samples classified to the functional connectivity by Krishna et al.12 and the epigenetic-based neural classification of our study. h, Correlation of neural signature with degree of peritumoral connectivity as defined by resting-state functional magnetic resonance imaging (rs-fMRI). Simple linear regression P = 0.05, error bands representing the 95% CI. i, Peritumoral functional connectivity (defined by rs-fMRI) in low- and high-neural glioblastoma. P = 0.0416, two-sided Mann–Whitney U-test. j, Functional connectivity to the contralateral hemisphere (defined by rs-fMRI) in low- and high-neural glioblastoma groups. NS, P > 0.05, two-sided Mann–Whitney U-test. k, Examples showing the region of interest (ROI)-to-voxel functional connectivity of the contrast-enhancing area to its peritumoral surrounding. Peritumoral connectivity of a high-neural glioblastoma (0.457) and mean functional connectivity to its peritumoral area of 0.837 (left). By contrast, a low-neural glioblastoma (0.347) is shown with mean functional connectivity to its peritumoral area of 0.294 (right).

