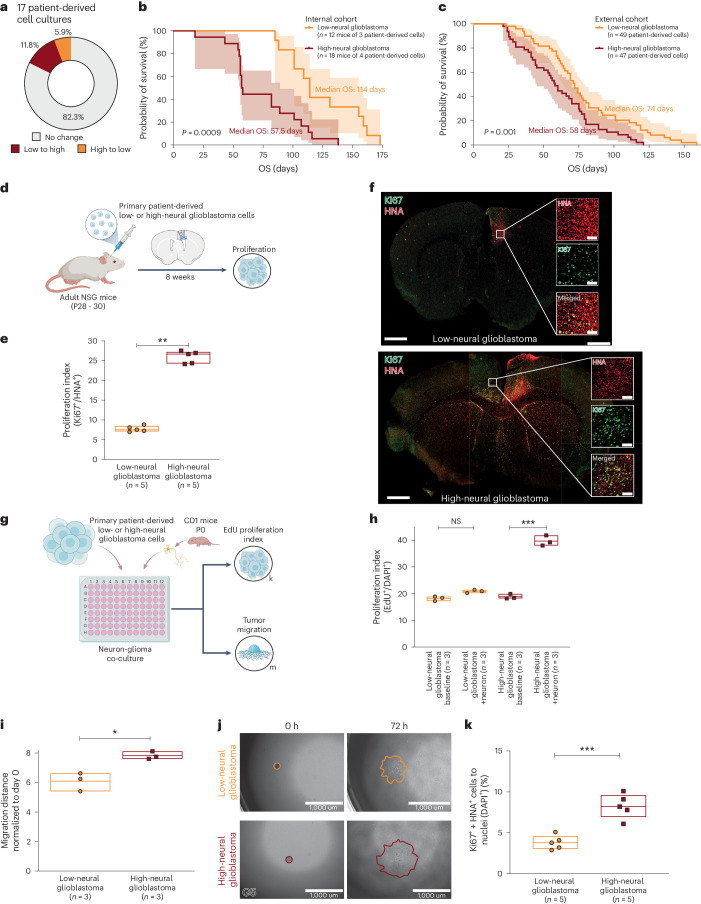
Fig. 5. Neural classification is conserved in cell culture and correlates with survival as well as proliferation.
a, Comparison of neural signature between patient’s tumor tissue and cell culture in 17 glioblastomas. b,c, Survival after xenografting of patient-derived low- and high-neural glioblastoma cells in our internal cohort (b) and two combined external cohorts (c). log-rank test, P = 0.0009 (b), P = 0.001 (c). Error bands represent 95% CI. d, Primary patient-derived low- and high-neural glioblastoma cell suspensions (n = 1 per group) were implanted into premotor cortex (M2) of adult NSG mice (n = 5 mice per group). Mice were perfused after 8 weeks of tumor growth and brains sectioned in the coronal plane for further immunofluorescence analyses. e, Proliferation index (measured by total number of HNA+ cells co-labeled with Ki67 divided by the total number of HNA+ tumor cells counted across all areas quantified) in low- and high-neural glioblastoma-bearing mice (n = 5 mice per group). P = 0.00819, two-tailed Student’s t-test. Data are mean ± s.e.m. f, Representative confocal images of proliferation index in low-neural (top) and high-neural glioblastoma (bottom) xenografts. Human nuclear antigen (HNA), red; Ki67, green. Scale bars, 1 μm (overview images) and 200 μm (magnified images). g, Experimental workflow. h, EdU proliferation index (measured by total number of DAPI+ cells co-labeled with EdU divided by the total number of DAPI+ tumor cells counted across all areas quantified) in low-neural (P = 0.418) and high-neural (P = 0.0000172) glioblastoma as monocultures and co-cultured with neurons. Two-tailed Student’s t-test, n = 3 biological replicates. Data are mean ± s.e.m. i,j, 3D migration assay analysis comparing distance of migration 72 h after seeding (i) and representative images at time 0 h (left) and 72 h (right) of low- and high-neural glioblastoma cells (j). P = 0.0115, two-tailed Student’s t-test, n = 3 biological replicates. Scale bars, 1 μm. Data are mean ± s.e.m. k, In vivo spread of tumor cells into corpus callosum in low- and high-neural glioblastoma. P < 0.0004, two-tailed Student’s t-test. Data are mean ± s.e.m. EdU, 5-ethynyl-2′-deoxyuridine; DAPI, 4,6-diamidino-2-phenylindole.

