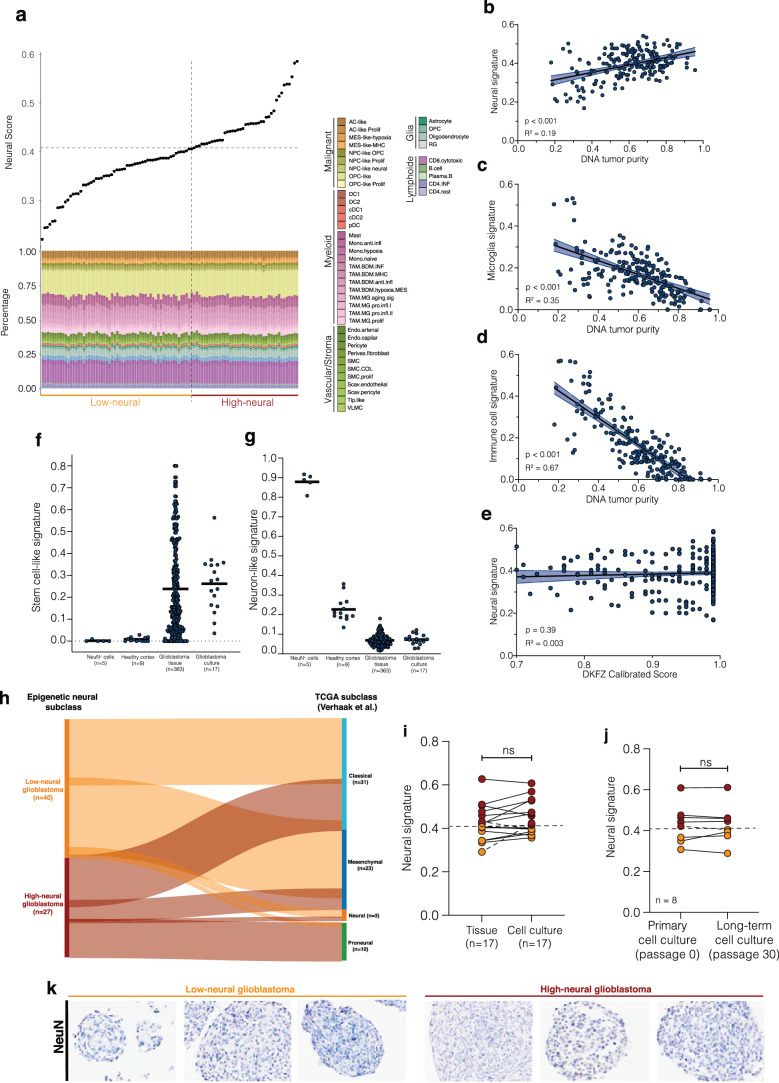
Extended Data Fig. 3. Quality measurements and reliability of the epigenetic neural signature in glioblastoma samples.
a). Integrated analysis of the individual patients' neural scores and the corresponding cell proportions obtained from RNA sequencing deconvolution. b). Correlation between the neural signature and DNA tumor purity. Simple linear regression P = 0.000000000063765, error bands representing the 95% confidence interval. c). Correlation between the microglia signature and DNA tumor purity. Simple linear regression P = 0.00000000041872, error bands representing the 95% confidence interval. d). Correlation between the immune cell signature and DNA tumor purity. Simple linear regression P = 0.000000000019814, error bands representing the 95% confidence interval. e). Correlation between the DKFZ calibrated score for the diagnosis ‘IDH-wild-type glioblastoma’ and the neural signature. Simple linear regression P = 0.2803, error bands representing the 95% confidence interval. f, g). Single-cell deconvolution of DNA methylation profiles compare f). stem cell-like and g). neuron-like signatures in NeuN+ cells, healthy cortex, glioblastoma tissue samples, and glioblastoma cell cultures. h). Overlap between the epigenetic neural classification and TCGA subtypes after integrated RNA sequencing analysis. i). Comparison of neural signature between patient’s tumor tissue and cell culture in 17 glioblastomas. Two-sided t-test P = 0.2593. j). Stability of the epigenetic neural signature during long-term cell culturing. Data were obtained from a publicly available dataset (n =6, GSE181314) and in-house (n = 1). Two-sided t-test P = 0.8471. k). Demonstration of NeuN+ staining in glioblastoma neurospheres. n=15 biological replicates.

