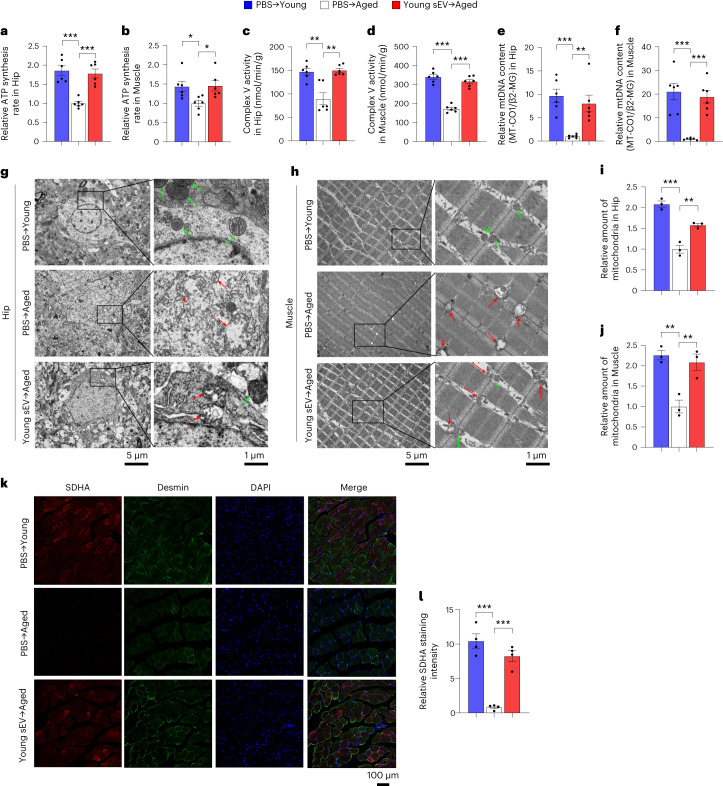
Fig. 4. Young sEV injection counteracts mitochondrial deficiency and improves metabolic health in aged mice.
Aged male mice (21 months) were intravenously injected with 200 μl of PBS or young sEVs (from 2-month-old male mice) seven times over 2 weeks, and then the two groups of aged mice were subjected to assessments of mitochondrial functional parameters and metabolic phenotypes. Young male mice (2 months) were simultaneously injected with PBS to serve as a control group. a,b, ATP synthesis rates in the hippocampus and muscle of each group (n = 6). c,d, Mitochondrial complex V activity in the hippocampus and muscle of each group (n = 6). e,f, Relative mtDNA content in the hippocampus and muscle of each group (n = 6). MT-CO1, normalized to β2-MG, was used to measure mtDNA copy number. g,h, Representative TEM images showing the structure and density of mitochondria in the hippocampus and muscle of each group. Normal mitochondria are round or oval shaped and contain well-defined cristae, whereas aged mitochondria become swollen, vacuolated and even broken, with cracked mitochondrial cristae. The green arrow indicates morphologically normal mitochondria, and the red arrow indicates morphologically damaged mitochondria. Scale bars, 5 µm in the left panel and 1 µm in the right panel. i,j, Quantification of the numbers of mitochondria in the sections (at low magnification) of hippocampus and muscle (n = 3). k,l, Immunofluorescence staining of SDHA (red), Desmin (green) and DAPI (blue) in the muscle fibers of each group. Representative images (scale bar, 100 μm) and quantification results (n = 4) are shown. Significance was determined using one-way ANOVA followed by Dunnett’s multiple comparison test in a–f, i, j and l. *P < 0.05, **P < 0.01 and ***P < 0.005.

