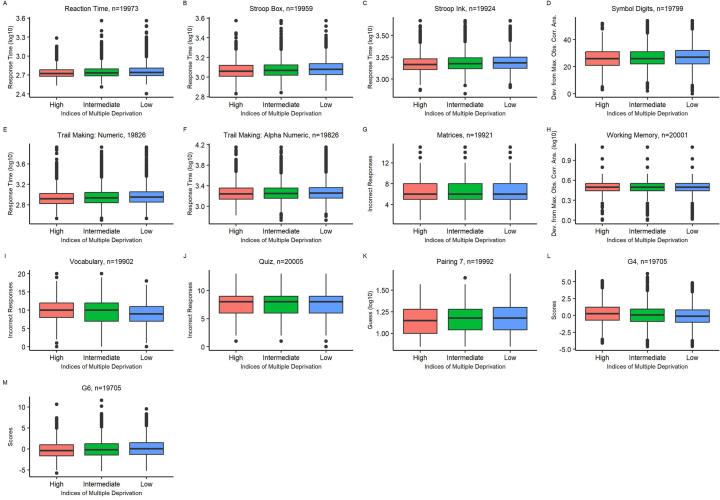
Extended Data Fig. 8. (A-K) Cognitive tests Scores by groups of multiple deprivation and (L-M) Measures of general cognitive ability (G4 and G6) by groups of multiple deprivation.
Across all plots, the x-axis represents groups of multiple deprivation, and the y-axis represents score for the corresponding test or measures of general cognitive ability. Response Time is the average time taken per item. In each box plot (A-L), the box represents the interquartile range, with the center line denoting the median. The edges of the box indicate the first and third quartiles, while the whiskers extend to span a range of 1.5 interquartile distances from the edges. Individual data points that fall beyond the whiskers are presented as circles.

