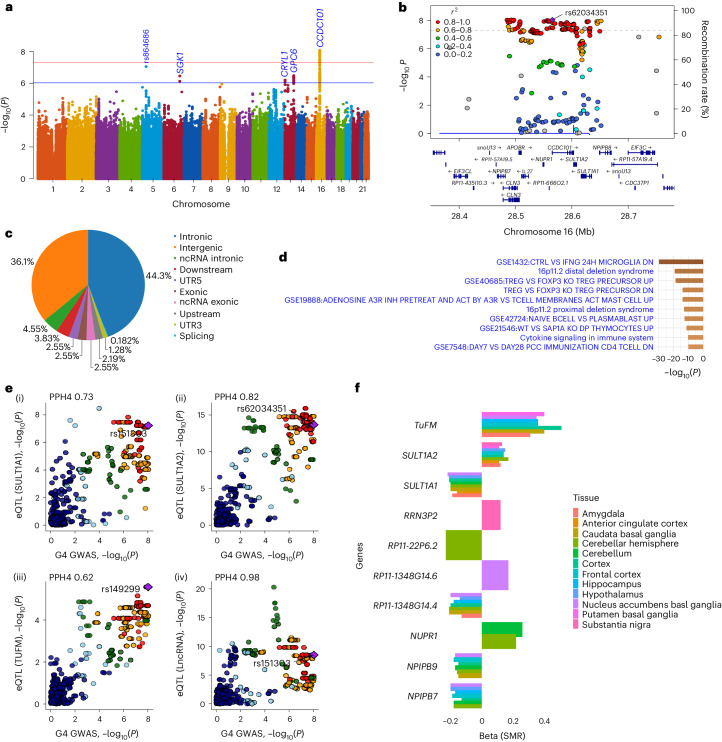
Fig. 4. Genetic associations with G4 and likely functional relevance.
a, A Manhattan plot of the genome-wide association analysis of G4. The x axis shows SNP chromosome positions, and the y axis shows the corresponding −log10 two-tailed P values from the two-sided BOLT infinitesimal model. The horizontal red line indicates the genome-wide significance threshold at P = 5 × 10⁻⁸. The horizontal blue line indicates the suggestive genome-wide significance threshold at P = 1 × 10⁻⁶. The nearest gene or top SNP is highlighted for loci associated at P < 1 × 10⁻⁶. b, Regional association and LD plots for G4-associated genome-wide significant locus. The x axis shows the SNP position on the chromosome, and the y axis shows the −log10(P value). The independent SNP is indicated by the purple diamond. The circles show other SNPs in pairwise LD with the independent SNP, with color indicating the strength of LD (r2). The strength of LD (r2) is presented in the upper left corner of the plot. The dashed horizontal line indicates genome-wide significant threshold. Estimated recombination rates are marked in light blue. Bottom: genes within ±200 kb of the independent SNP. c, A pie chart showing the proportion of the functional consequences of the G4-associated independent SNP and its proxies as annotated with ANNOVAR. d, Pathway and process enrichment analysis of genes mapped for G4 locus. The figure presents the top ten clusters along with their respective enriched terms (one per cluster). P values (−log10 transformed) are computed using the cumulative hypergeometric distribution, and the most statistically significant term within each cluster is selected to represent it. e, Colocalization of G4-associated signals with microglia eQTLs at SULT1A1 (i), SULT1A2 (ii), TUFM (iii) and long noncoding RNA (lncRNA) (iv). Each colored point indicates the strength of LD (red, ≥0.8; orange, 0.6–0.8; green, 0.4–0.6; light blue, 0.2–0.4; dark blue, <0.2) with candidate SNP (purple diamond labeled with rsID). PPH4 values indicate PP in support of shared single causal variants between the traits. PPH3 values indicate PP in support of sharing different causal variants between traits. f, A bar graph showing evidence from SMR between G4-GWAS and GTEx (v8) Brain eQTLs (cis) for G4-associated locus. The x axis represents coefficients from SMR for associated brain tissues (indicated by color), and the y axis represents prioritized genes.

