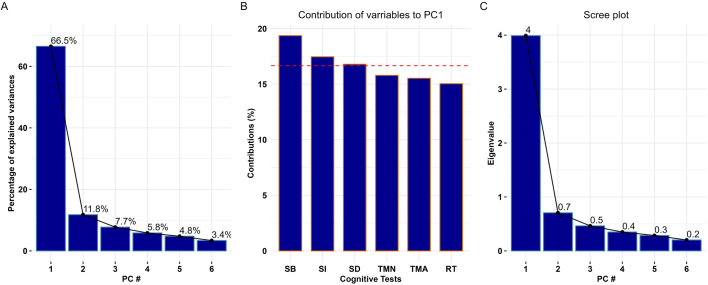
Extended Data Fig. 3.
(A) Percentage of variance explained by principal components (PCs) derived from six cognitive tests (SB: Stroop Box, SI: Stroop Ink, SD: Symbols Digit, TMN: Trail Making Numeric, TMA: Trail Making Alpha Numeric, RT: Reaction Test), (B) Contribution of each of the six cognitive tests to PC1. Horizontal red (dashed) line expected value of each test if the contribution where uniform, and (C) Generalised scree plot for PCs derived from SB, SI, SD, TMN, TMA and RT tests.

