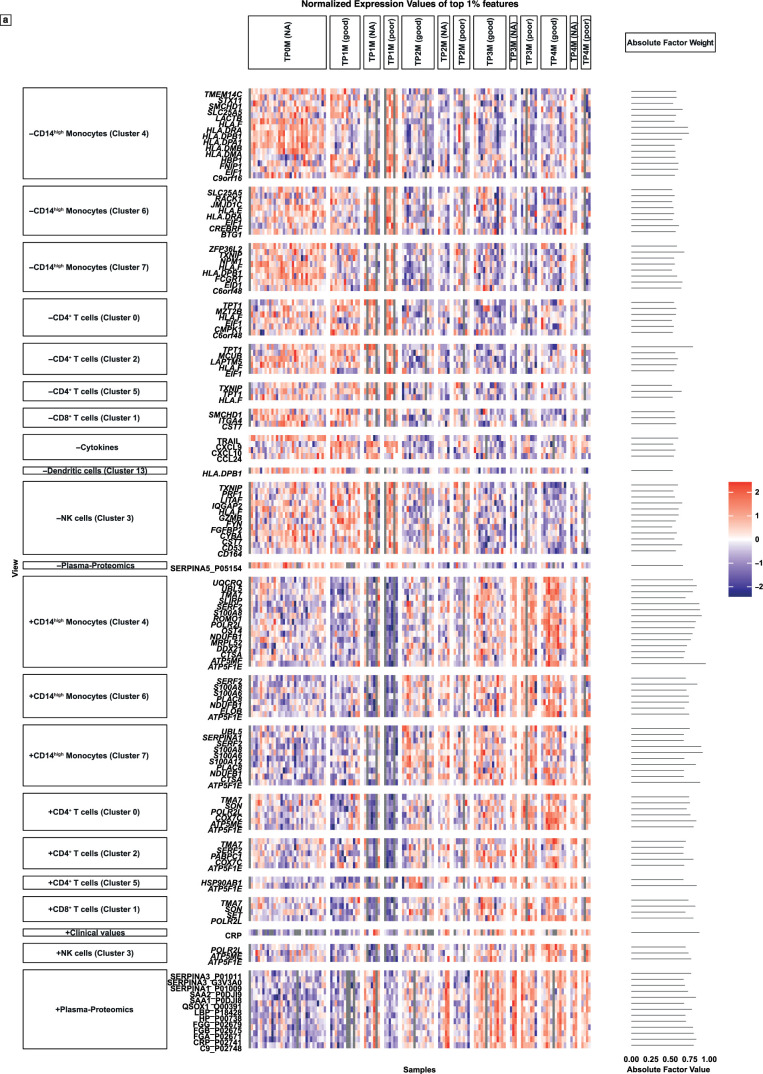
Extended Data Fig. 8. Gene expression changes across time and outcome in IAR.
(a) Integrative ACS Repair (Factor 4). Normalized expression values of top 1% features in longitudinal comparison visualized within heatmap and weight of the features visualized as barplot, all samples included (n=128). Divided by outcome; ‘NA’ in case no EF value has been available for the ACS samples (n=7) and for CCS and non-CCS samples. (+/- indicates the direction of the feature factor weight).

