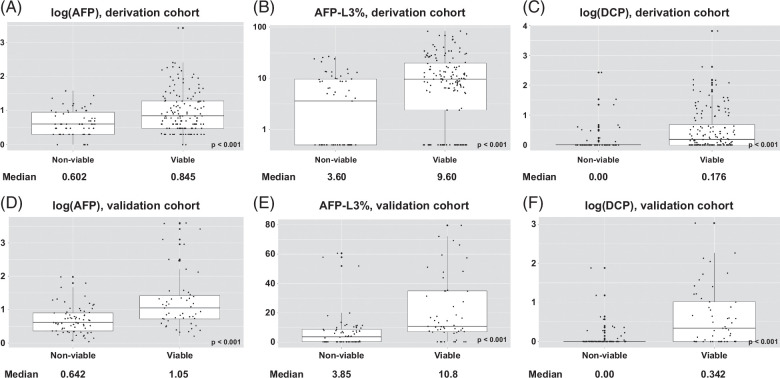
FIGURE 1.
Comparison of serum biomarker levels among patients with viable tumors versus nonviable tumors in the derivation set and validation set. (A) Log (AFP), derivation set (bars represent 25th and 75th percentiles, vertical lines extending out from the box represent 1.5 [Quartile 3 – Quartile 1], bold line inside the box plot represents median levels). Level of significance: p < 0.001 (Wilcoxon test). (B) AFP-L3%, derivation set (bars represent 25th and 75th percentiles, vertical lines extending out from the box represent 1.5 [Quartile 3 − Quartile 1], bold line inside the box plot represents median levels). Level of significance: p < 0.001 (Wilcoxon test). (C) Log (DCP), derivation set (bars represent 25th and 75th percentiles, vertical lines extending out from the box represent 1.5 [Quartile 3 − Quartile 1], bold line inside the box plot represents median levels). Level of significance: p < 0.001 (Wilcoxon test). (D) Log (AFP), validation set (bars represent 25th and 75th percentiles, vertical lines extending out from the box represent 1.5 [Quartile 3 − Quartile 1], bold line inside the box plot represents median levels). Level of significance: p < 0.001 (Wilcoxon test). (E) AFP-L3%, validation set (bars represent 25th and 75th percentiles, vertical lines extending out from the box represent 1.5 [Quartile 3 − Quartile 1], bold line inside the box plot represents median levels). Level of significance: p < 0.001 (Wilcoxon test). (F) Log (DCP), validation set (bars represent 25th and 75th percentiles, vertical lines extending out from the box represent 1.5 [Quartile 3 − Quartile 1], bold line inside the box plot represents median levels). Level of significance: p < 0.001 (Wilcoxon test). Abbreviations: AFP, alpha-fetal protein; AFP-L3%, lens culinaris-agglutinin-reactive fraction of AFP; DCP, des-gamma-carboxy prothrombin.

