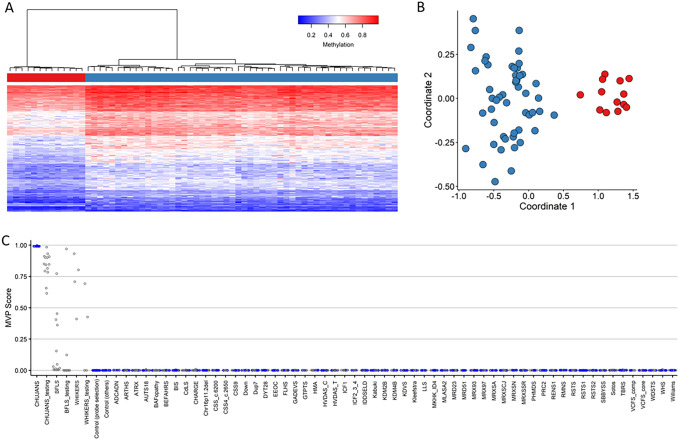
Fig. 2.
CHUJANS Episignature. A Hierarchical clustering was performed, where the rows represented the selected probes and columns represented the samples. The color scale illustrated the methylation levels from blue (0 or no methylation) to red (1 or full methylation). CHUJANS and control groups are labeled red and blue, respectively. Clear separation of the case and control groups was observed. B An MDS plot was generated, with red and blue circles representing the CHUJANS and control individuals, respectively. The plot depicted the distinct methylation pattern of CHUJANS from controls. C MVP scores were generated by the SVM classifier, with blue and grey circles representing training and testing samples, respectively. The low scores of testing samples from other disorders with known episignatures (with the exception of BFLS and WHIKERS samples) indicated the high sensitivity and specificity of the classifier. All CHUJANS validation samples received high MVP scores and were classified as CHUJANS. Using a cut-off value of 0.25 for the MVP score, all of the WHIKERS, two of the WHIKERS testing, four of the BFLS, and one of the BFLS testing samples were also positive for the CHUJANS episignature

