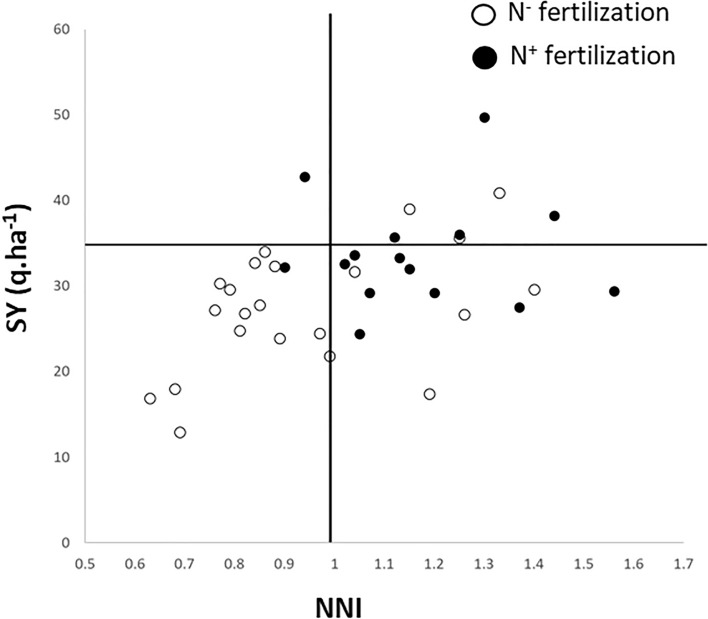
Fig. 1.
Relationship between mean values of seed yield (SY, Y-axis) and nitrogen nutrition index (NNI, X-axis) observed for the probe genotypes, Aviso and Montego, across the MET-47. Empty and plain circles correspond, respectively, to the N− and N+ nitrogen fertilization regimes. A vertical line was added and corresponds to a NNI value of 1, above which environment are considered as not impacted by N stress. The horizontal bar corresponds to a SY of 35 q ha−1 which is the targeted yield for N+ conditions

