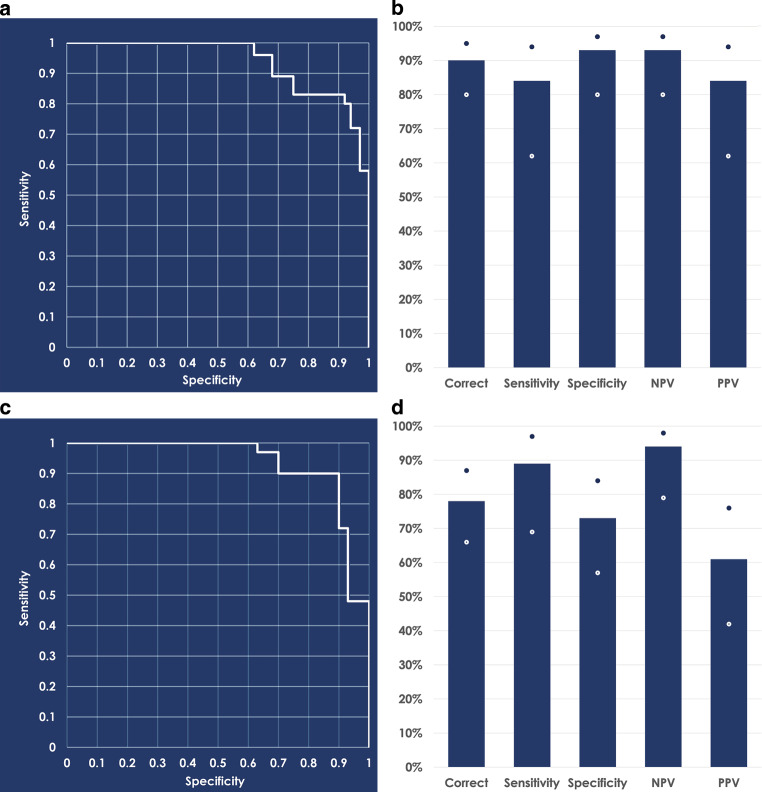
Fig. 2.
a Receiver operating characteristic curve obtained by the random forest classifier on the test set with an area under the curve of 0.9395; 95% confidence intervals are at [0.7908 0.9799]. b Classification of the random forest model with a 0.5 probability threshold. c Receiver operating characteristic curve obtained by the logistic regression classifier on the test set with an area under the curve of 0.937; 95% confidence intervals are at [0.8467 0.9812]. d Classification of the logistic regression model with a 0.5 probability threshold. White and blue dots in panels b and d represent the error bars. NPV negative predictive value, PPV positive predictive value
a ROC(„receiver operating characteristic“)-Kurve des Random-Forest-Klassifikators für den Testsatz mit einer Fläche unter der Kurve von 0,9395; 95%-Konfidenzintervalle liegen bei [0,7908 0,9799]. b Klassifizierung des Random-Forest-Modells mit einer Wahrscheinlichkeitsschwelle von 0,5. c ROC-Kurve des logistischen Regressionsklassifikators für den Testsatz mit einer AUC von 0,937; 95%-Konfidenzintervalle liegen bei [0,8467 0,9812]. d Klassifizierung des logistischen Regressionsmodells mit einer Wahrscheinlichkeitsschwelle von 0,5. NPV negativ prädiktiver Wert, PPV positiv prädiktiver Wert

