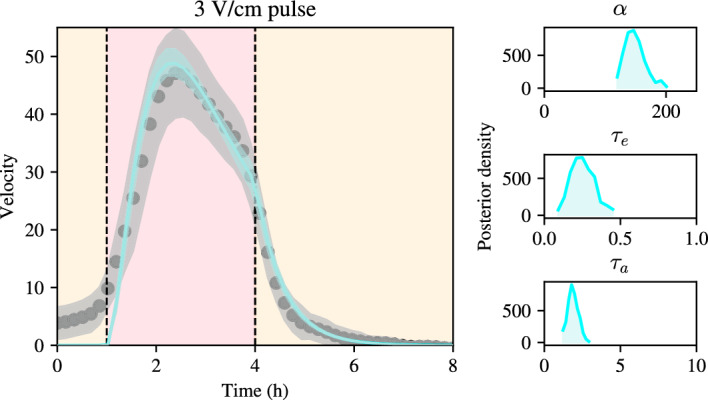
Fig. 3.

Bayesian inference on a simple model of adaptation and excitation given by Eq. (9) using experimental data from an electrotaxis experiment. Left: bulk velocity using a constant field of 3V/cm. Posterior mean of the model together with a confidence interval between the 5% and 95% quantiles of the model posterior predictions in cyan, experimental data and their confidence interval in grey. Notice the small width of the posterior predictive intervals. Right panels, from top to bottom: posterior distributions for model parameters, , , respectively (color figure online)
