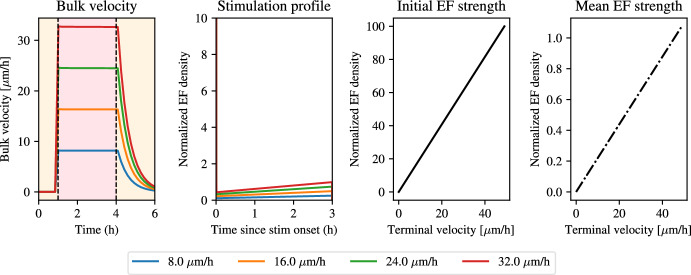
Fig. 6.
Stimulation profiles and electric field strengths for varying terminal velocities in optimal solutions to the problem in Eq. (33)). From left to right. Bulk velocity when using optimal control solution for constant stimulation using different values of terminal velocity (see legend). Optimal stimulation profile corresponding to the different terminal velocities in the left panel. Electric field strength at the start of stimulation. Electric field strength averaged during stimulation. Note the difference in the magnitude of the axes. Parameter values correspond to the posterior means for , , , and the pre-computed value for (color figure online)

