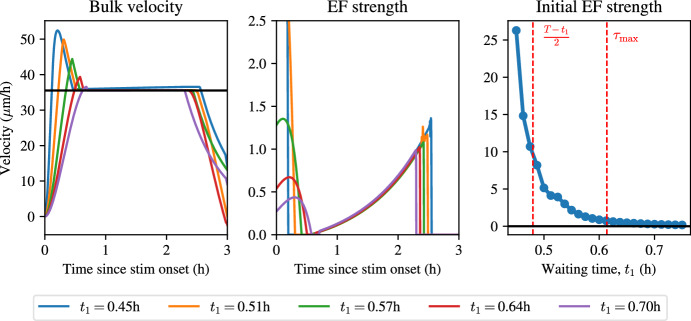
Fig. 8.
Optimal control to keep velocity constant in a small time window (solutions to the optimal control problem in Eq. (39)). Left: bulk velocity traces using different values of for stimulation. Middle: electric field strengths with different values of . Right: initial electric field strength in the optimal control solution as a function of . Parameter values correspond to the posterior means for , , , and the pre-computed value for (color figure online)

