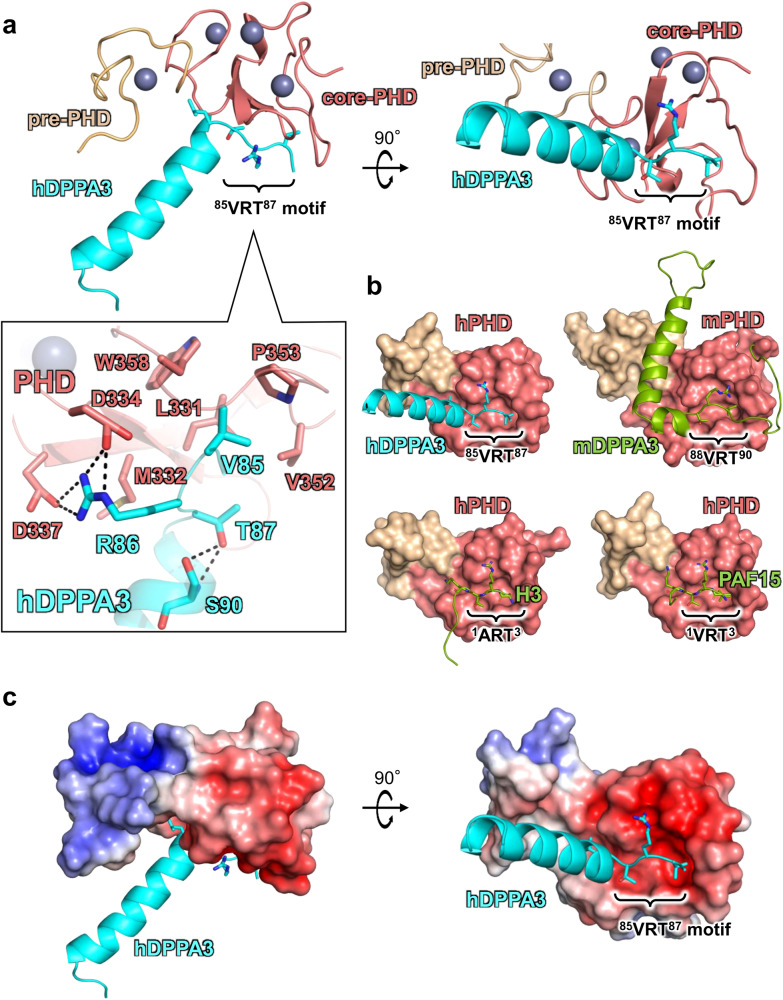
Fig. 2. Crystal structure of hDPPA381-118 in complex with hPHD.
a Overall structure of hPHD:hDPPA381-118 complex. Pre-PHD, core-PHD and hDPPA3 are depicted as gold, salmon, and cyan cartoon models, respectively. The conserved VRT motif in hDPPA3 is displayed as a stick model. Inset shows the interaction between the VRT motif of hDPPA3 and hPHD. The black dotted line represents a hydrogen bond. b Structural comparison of hPHD:hDPPA3 (this study, upper left), mPHD:mDPPA3 (PDB: 7XGA, upper right), hPHD:H3 (PDB: 3ASL, bottom left) and hPHD:PAF15 (PDB: 6IIW, bottom right) complexes. mDPPA3, H3 and PAF15 are shown as a green cartoon model and VRT (ART) motif are represented as stick model. c Electrostatic surface potential of hPHD calculated with program APBS56. The red and blue surface colors represent negative and positive charges, respectively. hDPPA3 is depicted as a cyan cartoon.

