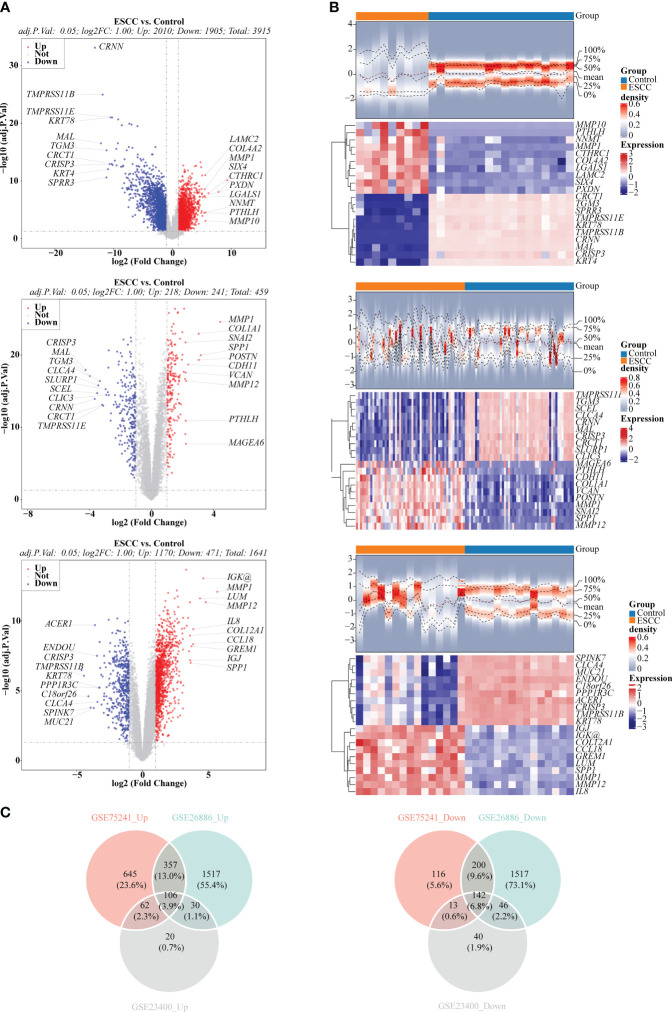
Figure 1.
Selection of differentially expressed genes (DEGs) between ESCC and control samples. (A) Volcano plots depicted DEGs in GSE26886, GSE23400 and GSE75241 dataset, respectively. Red: upregulation; blue, downregulation. (B) Heatmaps depicted DEGs in GSE26886, GSE23400 and GSE75241 dataset, respectively. (C) Venn diagrams revealed 106 up-regulated overlapping DEGs and 142 down-regulated overlapping DEGs, respectively.

